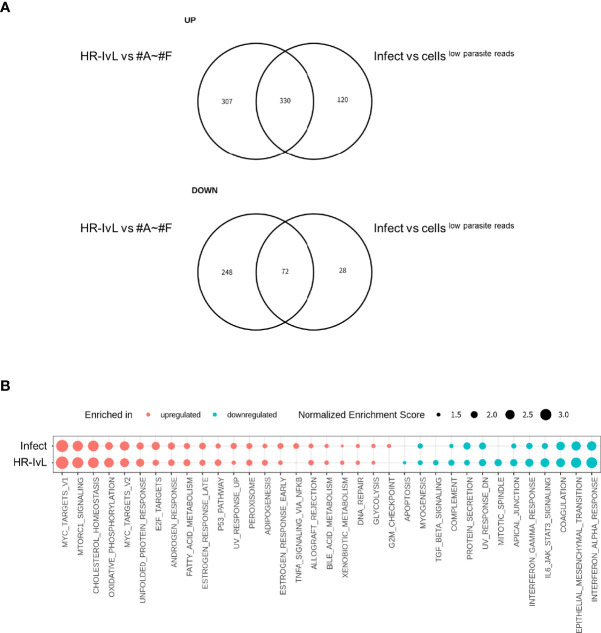
Figure 3.
Altered host gene expression in infected cells is correlated with that detected in the host cell subset “HR-IvL”. (A) Genes with log2 fold change over 0.5 and Benjamini–Hochberg adjusted p-value (False Discovery Rate: FDR) less than 0.05 were flagged as differentially expressed genes (DEGs). Upregulated (top panel) or downregulated (bottom panel) DEGs in infected cells vs. cellslow parasite reads were compared with those in “HR-IvL” vs. “#A–#F” clusters. (B) Normalized enrichment scores for gene set enrichment analysis (GSEA) are shown. Enriched pathways for upregulated genes are shown in red, and those for downregulated genes are shown in blue. Enriched pathways with FDR less than 0.05 in either infected cells vs. cellslow parasite reads or HR-IvL vs #A–#F are shown. Pathways with FDR < 0.05 are shown with solid circles. “Infect” and “HR-IvL” indicate infected cells vs. cellslow parasite reads and HR-IvL vs. #A–#F. respectively.

