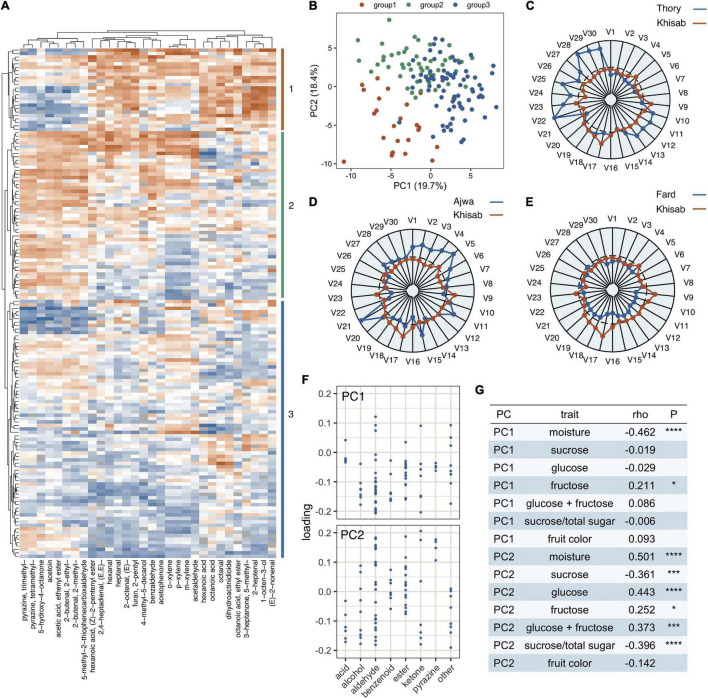
FIGURE 1.
Variation in volatile composition of fruits from 148 date palms (Phoenix dactylifera). (A) Hierarchical clustering of date palm samples (vertical axis) and volatiles (horizontal axis) based on 30 volatiles. The heatmap represents transformed volatile concentrations (orange = high, blue = low). (B) PCA of 148 date palms based on 80 volatiles. (C–E) Radar plots contrasting volatile composition in “Thory,” “Ajwa,” and “Fard” varieties representing groups 1,2 and 3, respectively, contrasted with the “Khisab” variety. Volatiles (V1-30) correspond to the 30 volatiles in (A) read from left to right. (F) Loadings for axes 1 and 2 of the PCA in (B) for volatiles categorized by their class as defined in Table 1. (G) Table of Spearman’s Correlations of fruit traits and volatiles across date palm samples. Statistical significance is represented as *P < 0.05, ***P < 0.0005, and ****P < 0.00005, All analyses in (A–F) were conducted on log-transformed values scaled by Z-score transformation separately for each volatile. Outlier Z-score values were collapsed to –3 and 3 prior to clustering, heatmap, and radar plot production.

