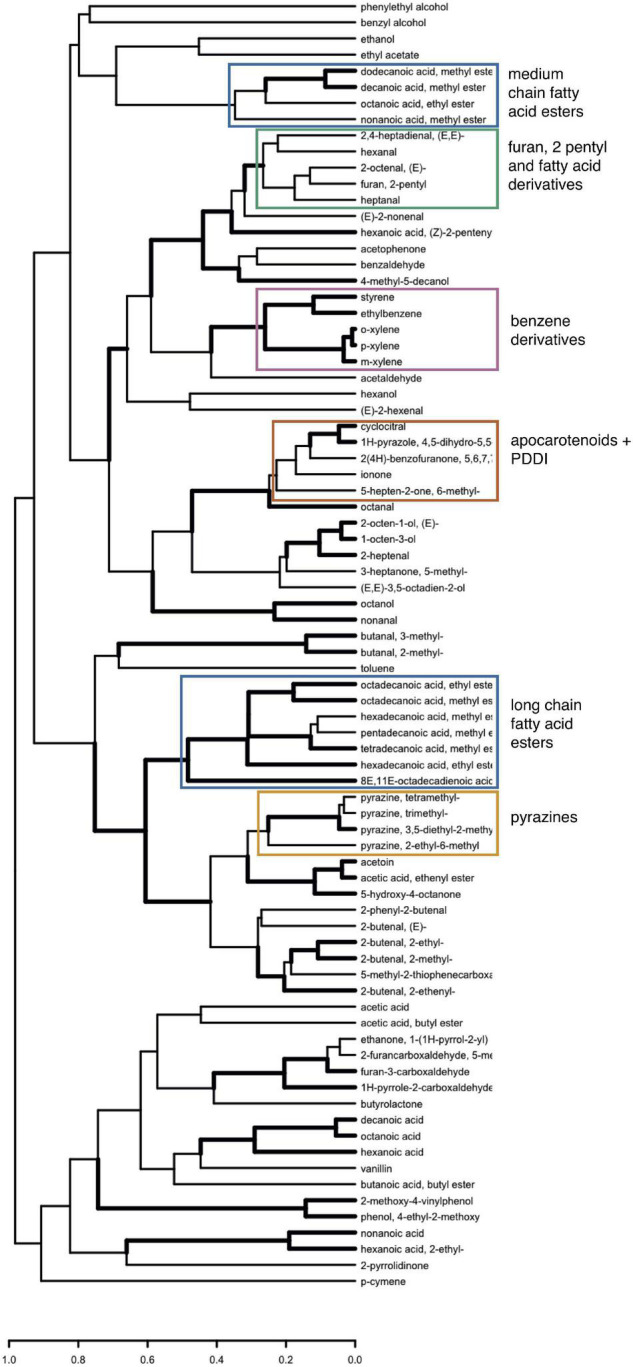
FIGURE 5.

Hierarchical clustering analysis of 80 volatiles across date palm samples based on Spearman’s rank correlation. Distances used in clustering were calculated as 1—ρ. Edges represented by heavy lines are supported by approximately unbiased P-values < 0.05 inferred from bootstrapping.
