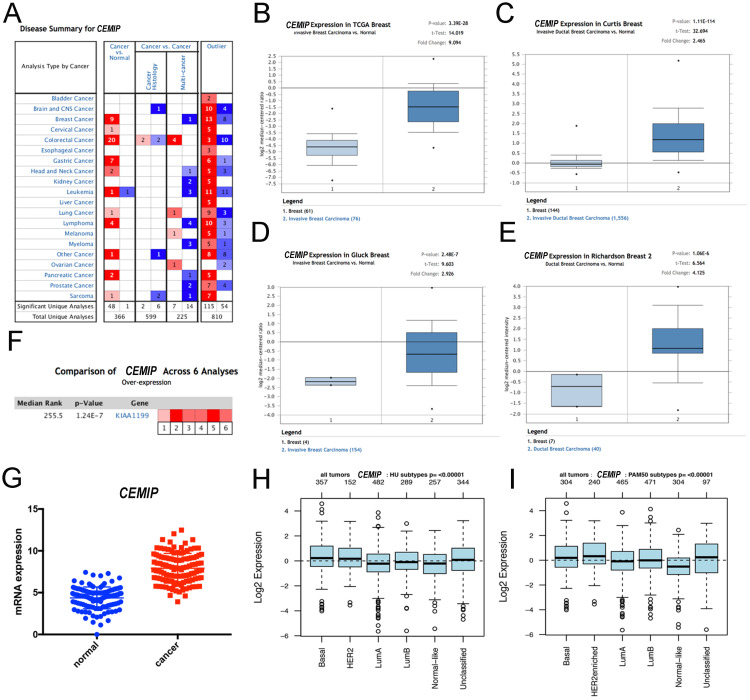
Figure 1.
Exploration the expression of CEMIP in BC tissues and normal breast tissues. A: The level of CEMIP mRNA in different cancer types gained from Oncomine database. The graph presented the number of datasets with statistically significant target genes with increased (red) or reduced expression (blue). B-E: Comparison of CEMIP mRNA expression in BC tissues and normal tissues in different study subgroups. F: Meta-analysis of multiple study datasets for comparison of CEMIP expression between BC tissues and normal breast tissues. G: The expression of CEMIP mRNA in BC tissues and normal breast tissues gained from TCGA database. H-I: The level of CEMIP mRNA expression in BC patients with different molecular subgroups in GOBO database.

