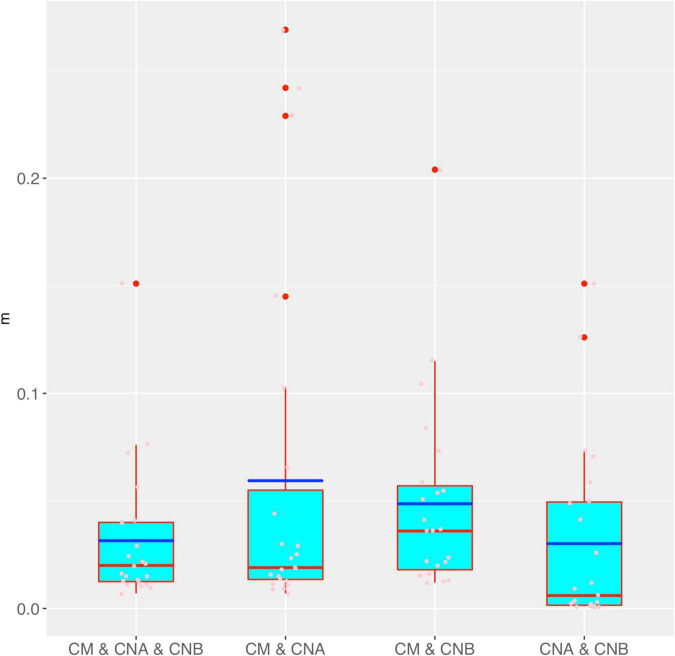
FIGURE 4.
The box chart for the immigration probability (m) estimated with the MSN models for the four different meta-community settings (also see Table 3 for the p-values of the significance test for their differences in m). Box red lines, blue lines, edges, whiskers, and bigger red points signify the median, mean, inter-quartile range (IQR), 1.5 × IQR, and > 1.5 × IQR, respectively. The smaller points in each box are the real values of m of each sample.

