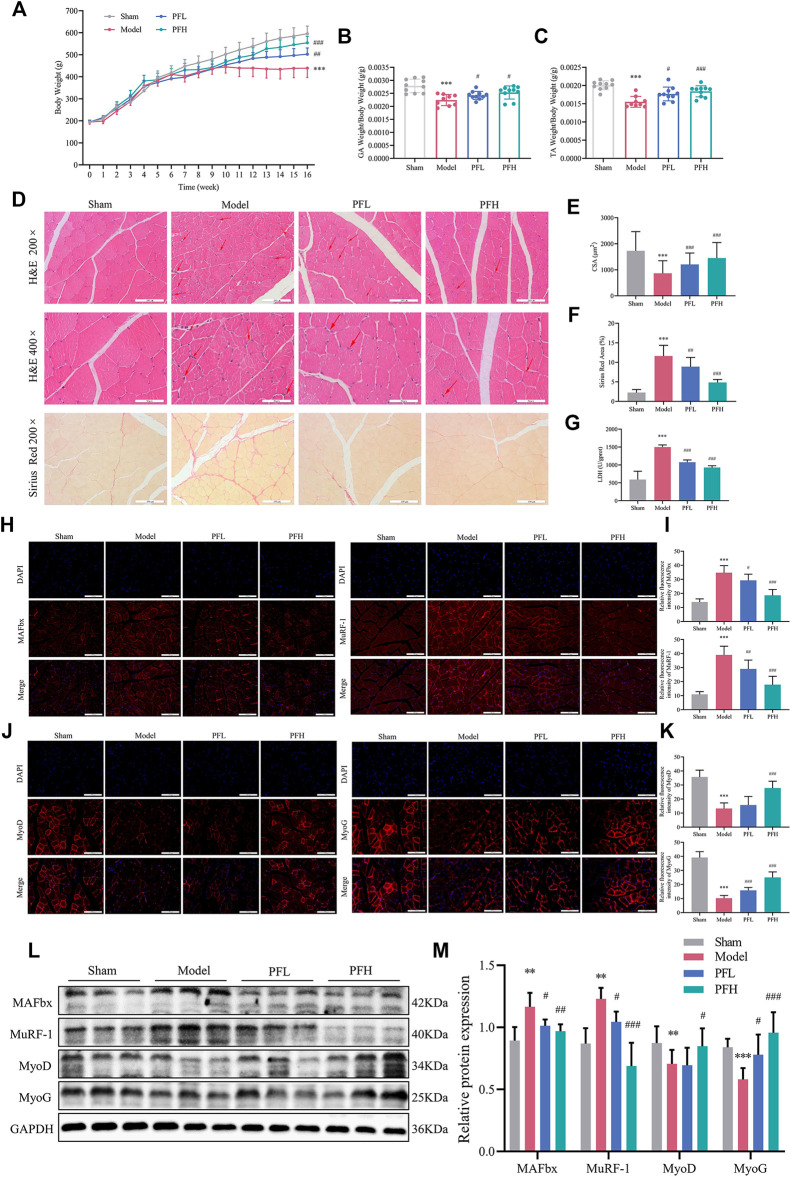
FIGURE 2.
PF inhibited skeletal muscle atrophy in CKD model rats. (A) Body weight was evaluated weekly throughout the entire 16-weeks experimental period. (B, C) Weights of GA and TA muscles normalized by the final body weight. (D) Cross sections of TA muscle stained with H&E and Sirius Red. The red arrows indicate myofibers affected by atrophy, such as inflammatory cell infiltration, uneven muscle fiber thickness and cell nucleus displacement. Representative images of H&E staining (200× and 400×, scale bars: 100 and 50 μm). Representative images of Sirius Red staining (200×). (E) The cross-sectional area (CSA) of the TA muscle fibers of each group was measured (∼150 myofibers in each group). (F) The Sirius red area of the TA muscles (n = 15). (G) LDH levels in muscles. (H) MAFbx and MuRF-1 expression in the GA muscles was detected by immunofluorescence staining (200×, scale bars: 100 μm) using antibodies against MAFbx (red) and MuRF-1 (red), and the nuclei were detected via DAPI (blue) staining. (I) The relative fluorescence intensities of MAFbx and MuRF-1 were compared between the groups (n = 20). (J) Sections of GA muscle from different groups were examined with immunofluorescence staining (200×) using anti MyoD (red), anti MyoG (red) and DAPI (blue). (K) The relative fluorescence intensities of MyoD and MyoG were compared between groups (n = 20). (L) Representative immunoblotting of MAFbx, MuRF-1, MyoD, MyoG and GAPDH. (M) Quantification of protein expression in muscles (n = 6). The protein expression was normalized to that of GAPDH as a loading control. All of the data are expressed as the means ± S.Ds. Significant differences are indicated as * p < 0.05, ** p < 0.01, *** p < 0.001 vs. the Sham group. # p < 0.05, ## p < 0.01, ### p < 0.001 vs. the Model group.

