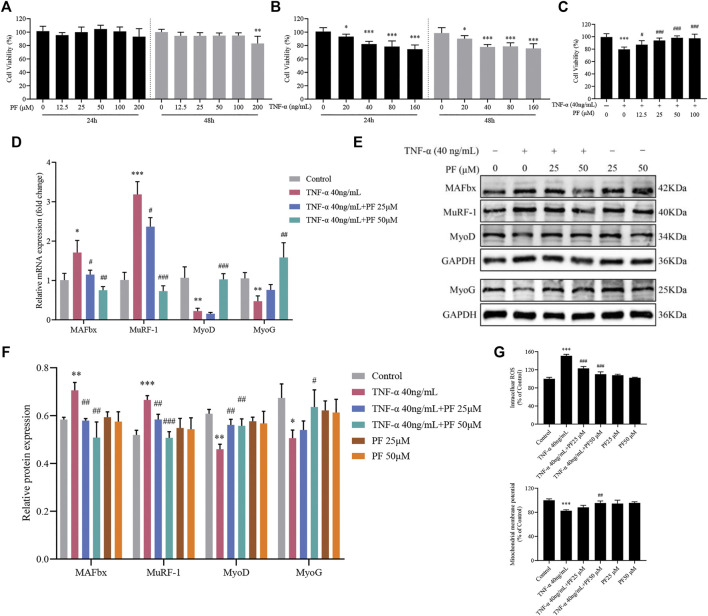
FIGURE 6.
PF suppressed TNF-α-induced C2C12 myoblast damage. (A) C2C12 myoblasts were treated with TNF-α (0, 20, 40, 80 and 160 ng/ml) for 24 and 48 h. (B) Cytotoxicity of PF (0, 12.5, 25, 50, 100 and 200 μM) for 24 and 48 h. (C) Cells were treated with 40 ng/ml TNF-α and 12.5, 25, 50, and 100 μM PF for 48 h. Cell viability was measured with a CCK-8 assay (n = 6). * p < 0.05, ** p < 0.01, *** p < 0.001 compared with PF 0 μM or TNF-α 0 ng/ml. # p < 0.05, ## p < 0.01, ### p < 0.001 compared with the 40 ng/ml TNF-α group. (D) The expression of MAFbx, MuRF-1, MyoD and myoG was determined by RT–qPCR. (E) Representative western blots using antibodies against MAFbx, MuRF-1, MyoD, MyoG and GAPDH. (F) Quantification of protein expression. (G) PF inhibited intracellular ROS generation and increased Δψm in C2C12 cells. All protein expression was normalized to that of GAPDH as a loading control. The data are presented as the means ± S.D. n = 3, * p < 0.05, ** p < 0.01, *** p < 0.001 compared with the Control group. # p < 0.05, ## p < 0.01, ### p < 0.001 compared with the TNF-α 40 ng/ml group.

