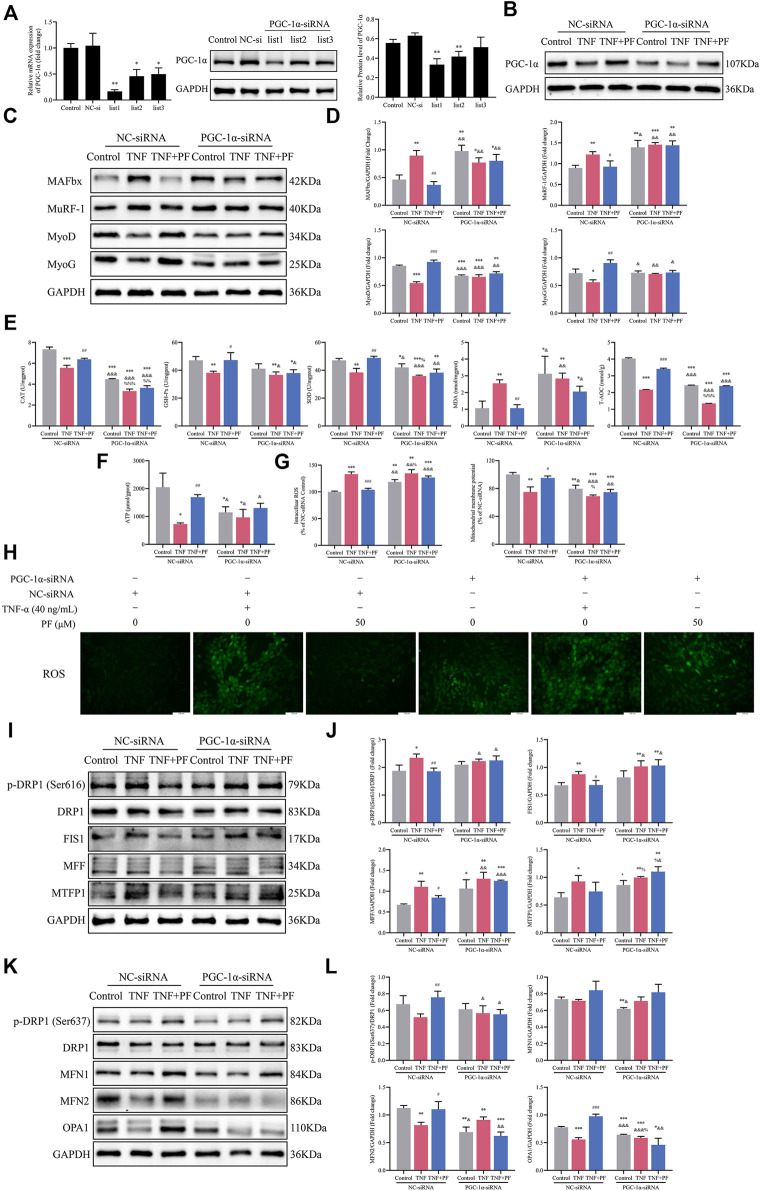
FIGURE 8.
PGC-1α might be important in mediating the effects of PF on TNF-α-treated C2C12 cells. (A) The protein and mRNA expression of PGC-1α was detected in C2C12 myoblasts transfected with PGC-1α-targeted siRNA (PGC-1α-siRNA) and nonspecific control siRNA (NC-siRNA). (B) Representative immunoblots of PGC-1α expression in NC-siRNA- and PGC-1α-siRNA-transfected C2C12 cells treated with TNF (TNF-α 40 ng/ml) and TNF + PF (PF 50 μM). (C) Representative western blots using antibodies against MAFbx, MuRF-1, MyoD, MyoG and GAPDH. (D) Western blot analysis. (E) The activities of CAT, GSH-Px, SOD, MDA, and T-AOC in C2C12 cells in different groups. (F) The expression of ATP in different groups. (G) The expression of intracellular ROS generation and Δψm in different groups. (H) Intracellular ROS were observed by the DCFH-DA (green) method using an inverted fluorescence microscope in different groups (200× scale bars: 100 μm). (I) Representative western blots using antibodies against p-DRP1 (Ser616), DRP1, FIS1, MFF, MTFP1 and GAPDH. (J) Western blot quantification. (K) Representative western blots using antibodies against p-DRP1 (Ser637), DRP1, MFN1, MFN2, OPA1, and GAPDH. (L) Quantification of protein expression. All protein expression was normalized to that of GAPDH as a loading control. The data are presented as the means ± S.D. n = 3, * p < 0.05, ** p < 0.01, *** p < 0.001 compared with the control group or the Control NC-siRNA group. # p < 0.05, ## p < 0.01, ### p < 0.001 compared with the TNF + NC-siRNA group; & p < 0.05, && p < 0.01, &&& p < 0.001 compared with the TNF + PF + NC-siRNA group; % p < 0.05, %% p < 0.01, %%% p < 0.001 compared with the Control PGC-1α-siRNA group.

