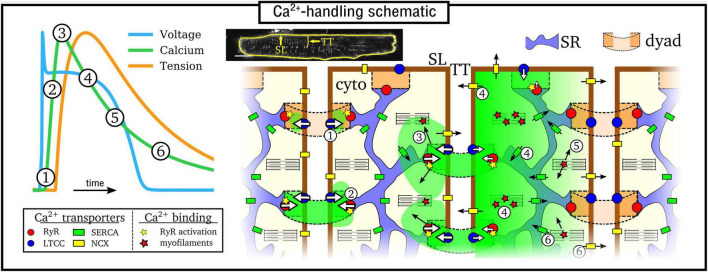
FIGURE 1.
Simplified illustration of the intracellular Ca2+-handling cycle in ventricular myocytes. Left: illustration of an action potential (voltage), calcium transient (CaT), and developed tension, with the different stages broadly labeled on the CaT. Right: cartoon schematic of the different stages of Ca2+ cycling in the intracellular volume. High Ca2+ concentration is indicated by the green areas; SL refers to the sarcolemmal membrane and TT to a transverse tubule, illustrated on a real cell image (modified from Gadeberg et al., 2016). Numbered stages correspond to those in the main text and are illustrated at different spatial locations of the schematic for brevity – it should be clarified that all stages occur throughout the cell volume.

