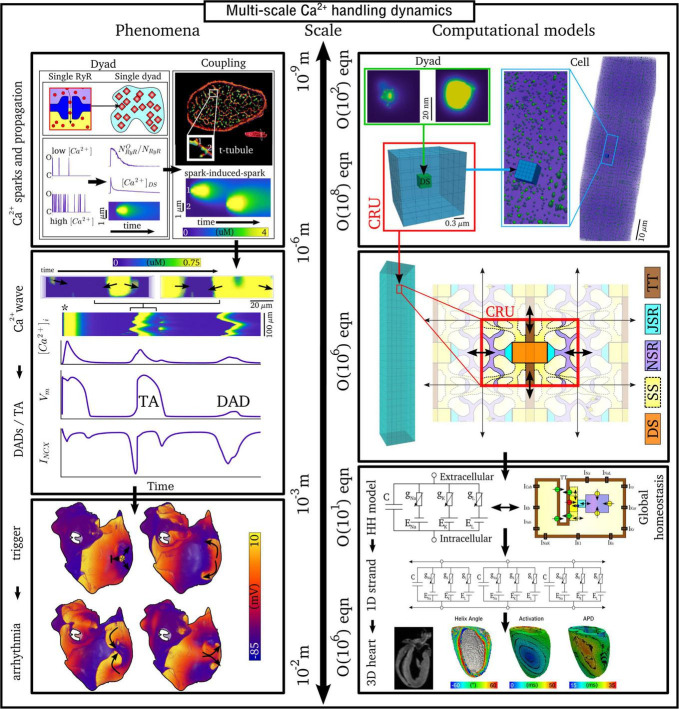
FIGURE 2.
Illustration of the scales involved in cardiac Ca2+-handling electrophysiology. Left, upper: illustration of a single RyR and the distribution of RyRs in a dyad, RyR channel function at low and high local Ca2+, and propagation of a Ca2+-spark between dyads. Cell-structure image re-rendered using data from Jayasinghe et al. (2018a). Left, middle: Illustration of an intracellular Ca2+-wave and the impact of the spontaneous Ca2+-transient on NCX and the action potential (AP), demonstrating both a delayed-after-depolarization (DAD) and triggered AP (TA). Left, lower: illustration of a focal excitation in tissue which degenerates into a re-entrant excitation pattern. Simulation data from Colman et al. (2013). Right, upper: spatial model of a single dyad (model as presented in Sheard et al., 2019) and illustration of a sub-micron full-cell model with dyads distributed therein. Right, middle: illustration of a coarse-grained 3D cell model with different intracellular and SR compartments labeled. Right, lower: illustration of standard, non-spatial Hodgkin-Huxley electric circuit models of cardiac electrophysiology, their coupling in a 1D strand, and implementation in 3D whole-heart models based on imaging data, reproduced using data from Benson et al. (2011).

