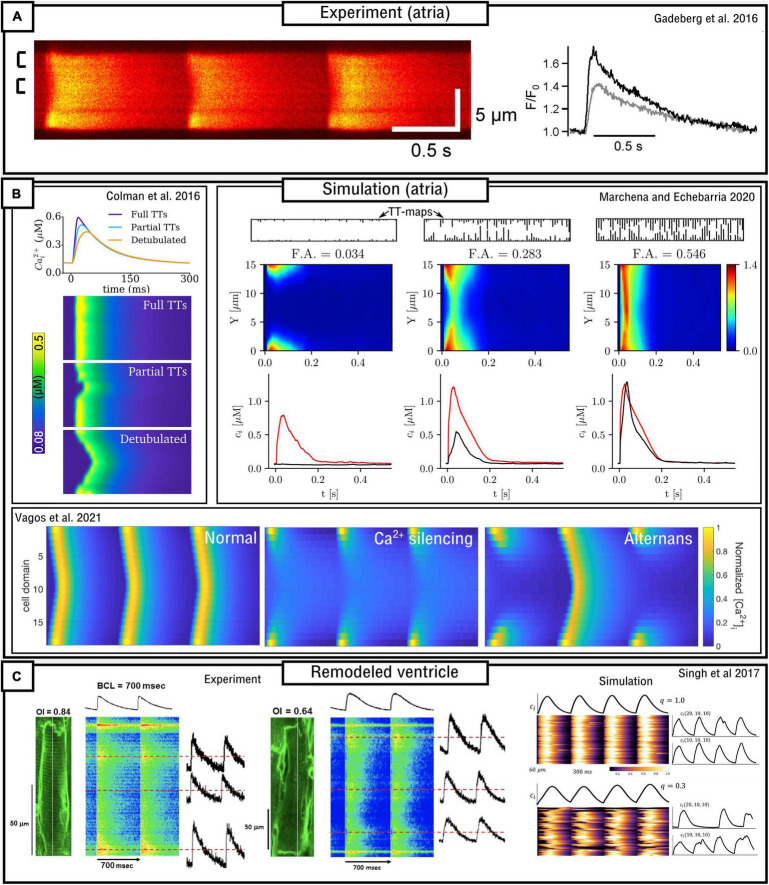
FIGURE 6.
Models of variable T-system density in atrial and remodeled ventricular myocytes. (A) Experimental data demonstrating “u” waves in pig atrial myocytes, and the corresponding local CaTs at the surface (black) and interior (gray) of the cell. Data is from Gadeberg et al. (2016). (B) Dynamics in different computational models of atrial cells, illustrating recapitulation of “u” waves, dependence on T-system density, and Ca2+ silencing and CaT alternans. Data from Colman et al. (2016); Marchena and Echebarria (2020), and Vagos et al. (2021). (C) Experimental and simulation data from remodeled ventricular myocytes (Singh et al., 2017), demonstrating a loss of T-system density and associated loss of spatial synchrony of the CaT, in relation to the Organizational index (OI; experiment) and the proportion of CRUs associated with LTCCs (q; simulation).

