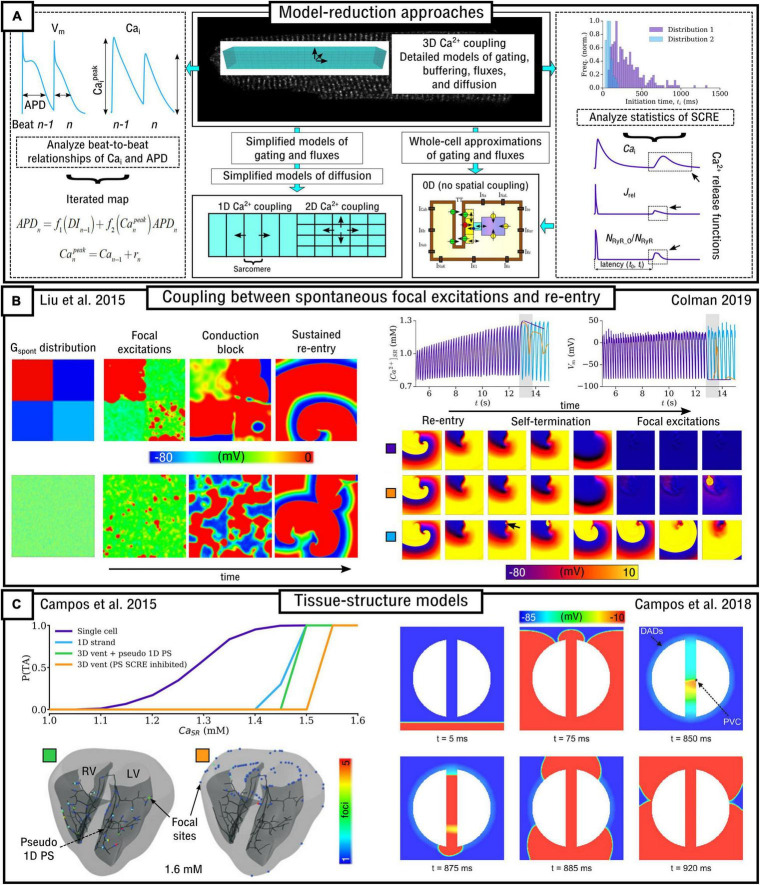
FIGURE 8.
Multi-scale modeling approaches. (A) Illustration of different approaches for reducing the computational intensity of models of sub-cellular Ca2+ handling. The center, upper panel illustrates a fully detailed 3D cell model, with biophysically detailed descriptions of gating, fluxes and diffusion. Below this panel are illustrated mathematical approaches for model reduction, either resulting in simplified spatial models (left) or non-spatial models (right). The left-most panel indicates how analysis of AP and CaT dynamics on a beat-to-beat basis can lead to the development of a non-spatial, iterated map model. The right-most panel illustrates how analysis of SCRE statistics enables the parameterization of analytical Ca2+ release functions which can be imposed in a traditional, non-spatial cell model. (B) Illustration of bi-directional coupling between focal excitations and re-entry. Left: spontaneous excitations interact with each-other to cause conduction block and re-entry, modified from Liu et al. (2015). Right: illustration of the emergence of focal excitations following self-termination after a period of re-entry, from Colman (2019). (C) Structurally detailed tissue models imeplementing SCRE. Left: probability of SCRE as a function of SR-Ca2+ in single-cell and 1D, 2D, and 3D with or without the pseudo-1D Purkinje System (PS), with the locations of focal exictations shown in the lower panel, modified from Campos et al. (2015); right: demonstration of a focal excitation emerging within the isthmus of an infarct borderzone, modified from Campos et al. (2018).

