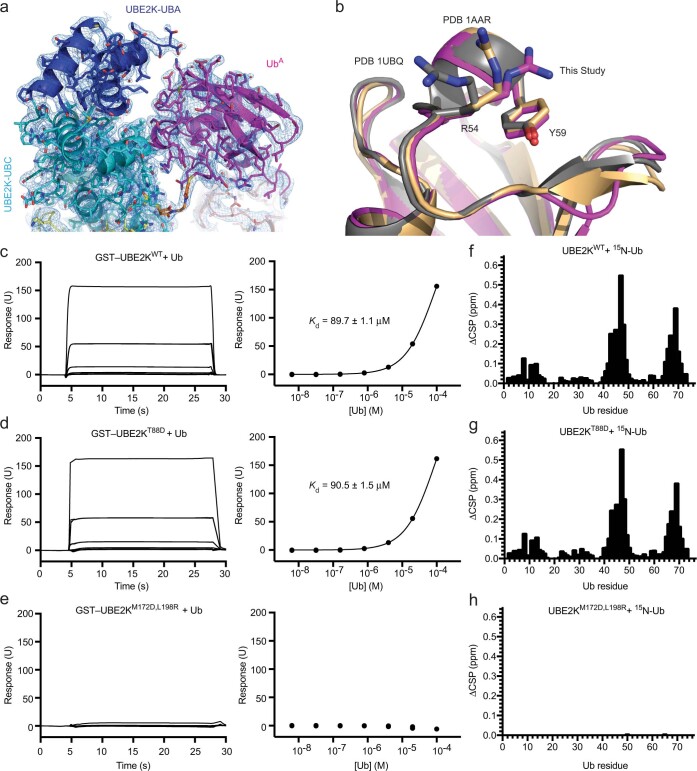
Extended Data Fig. 4. Analysis of the UBE2K/UbA binding interface.
(a) 2Fo-Fc map (1σ) is shown at the UBE2K-UbA binding interface. (b) Alignment of our UbA with known structures of Ub shows a role of Y59 in selecting a conformation of R54 at the UBE2K/UbA interface. (c-e) SPR analysis of UBE2K and Ub binding. Sensorgrams (left) and binding curves (right) for mono-Ub and (c) GST-UBE2KWT, (d) GST-UBE2KT88D and (e) GST-UBE2KM172D,L198R. n = 2 for each binding curve with Kd indicated where applicable. Residue specific CSPs for 200 μM 15N-Ub1 titrated until 2x molar excess of (f) UBE2KWT and (g) UBE2KT88D, and 5x molar excess of (h) UBE2KM172D,L198R. No measurable binding is observed for UBE2KM172D,L198R in either SPR or NMR. T88 is located at the UBE2K/UbA binding interface and UBE2KT88D is defective in UbA catalysis (Fig. 3e), yet UBE2KWT and UBE2KT88D have near identical affinity for Ub. These data suggest that the canonical M172/L198 Ub binding surface contributes to the bulk of Ub binding affinity detected and that the UBE2K acceptor site has weak affinity for UbA.

