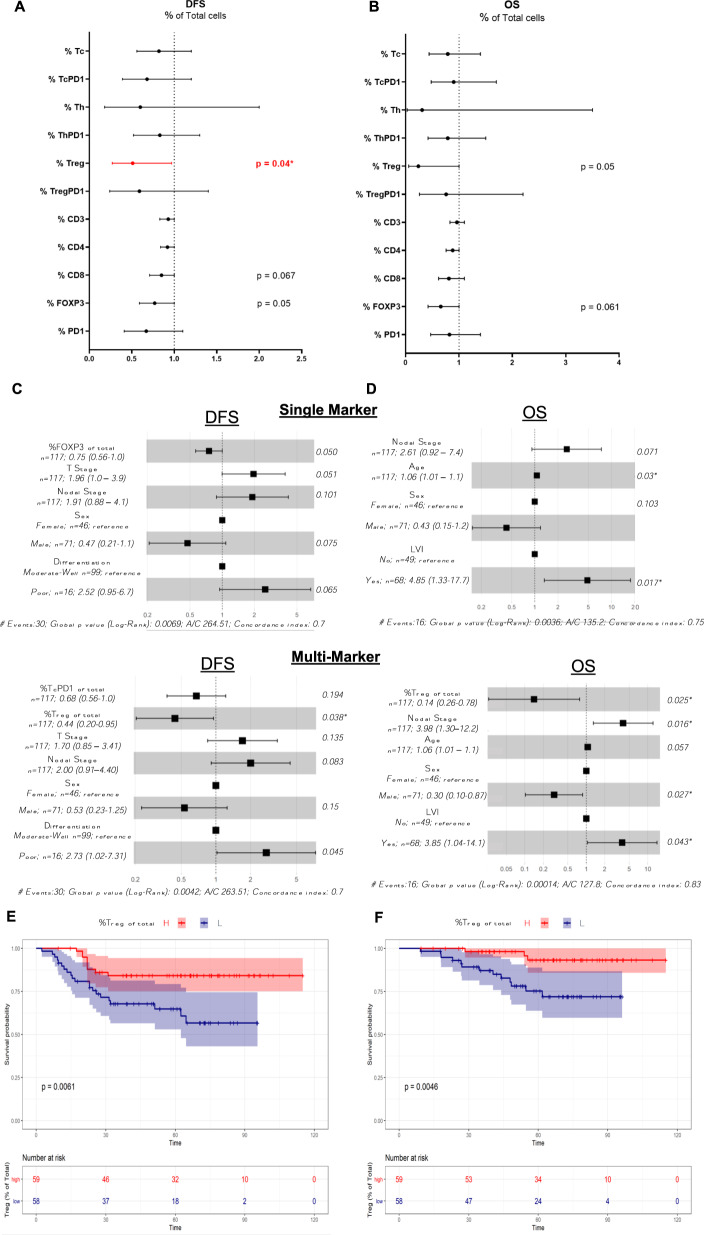
Fig. 6. Survival estimates for DFS and OS for T-cell scores in immune “hot-spot” regions.
Forest plots for multi-marker classification (Tc, TcPD1, Th, ThPD1, Treg, TregPD1) and single-marker classification (CD3, CD4, CD8, FOXP3, PD1) were generated for DFS (A) and OS (B). HRs, 95% CIs, and p values from likelihood ratio tests from univariate Cox proportional hazards models were calculated. In the multivariate analysis, the biomarkers were adjusted for clinical variables (T, N, age, sex, nodal count, positive nodes, differentiation, lymphovascular invasion) for DFS (C) and OS (D). Kaplan–Meier curves demonstrating univariate survival analysis for Treg levels in the immune hot-spot regions dichotomized on the median for DFS (E) and OS (F). Differences in Kaplan–Meier survival curves are presented as log-rank p value.

