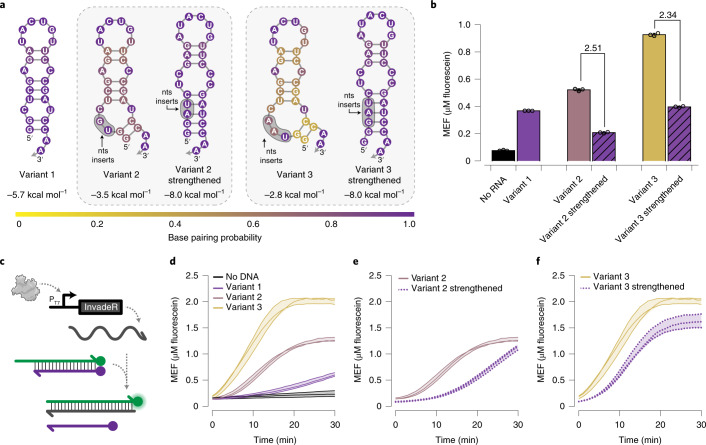
Fig. 2. Secondary structure of InvadeR impacts TMSD efficiency.
a, Three different variants of InvadeR were designed. Variant 1 includes the two initiating guanines followed by the sequence fully complementary to the fluorophore strand. For variants 2 and 3, two or three additional nucleotides were inserted between the initiating guanines and the InvadeR sequence (shaded regions), such that they disrupt the secondary structure at its base. Strengthened versions of variants 2 and 3 were created to stabilize the structure, while keeping the number and positions of the inserted nucleotides consistent. All variants have the same number of nucleotides that interact with the DNA signal gate. Minimum free energies and base pairing probabilities for each structure are predicted using NUPACK at 37 °C30. nts, nucleotides. b, Gel-purified InvadeR variants (5 µM) were added to an equimolar amount of the DNA signal gate, and fluorescence activation was quantified. Variant 3 generates the highest fluorescent signal followed by variants 2 and 1, whereas both strengthening mutants show a decrease in signal from their respective variants by the fold reduction indicated above the bars. c, When a DNA template encoding InvadeR is included with T7 RNAP and the DNA signal gate, the RNA output can be tracked in situ by monitoring fluorescence activation from the signal gate. d, Comparison of fluorescence kinetics of the three variants from IVT using an equimolar DNA template (50 nM) or a no-template negative control. e,f, Comparison of fluorescence kinetics between variants and their strengthening mutants for variant 2 (e) and variant 3 (f), shows that strengthening base pairs negatively impact fluorescence kinetics. All data shown are n = 3 independent biological replicates each plotted as a point (b) or a line (d–f) with raw fluorescence standardized to MEF (µM fluorescein). Each bar height in b represents the average over these replicates. Error bars (b) and shading (d–f) indicate the average of the replicates ± s.d.

