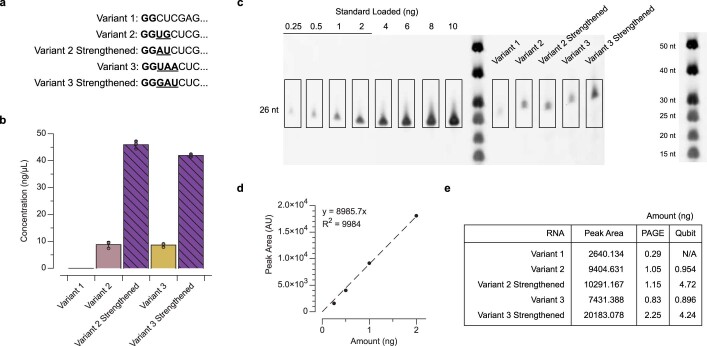
Extended Data Fig. 2. Transcription efficiency impacts the speed of TMSD.
a, The eight initially transcribed nucleotides of each InvadeR variant in Fig. 2a. Nucleotides that are not part of the InvadeR sequences are bolded, and inserted nucleotides are underlined. b, Concentrations of each variant from IVT reactions measured by the Qubit RNA HS assay kit (Invitrogen, catalog no. Q32852). Each variant was produced in situ in the presence of the DNA signal gate for 30 min and extracted (see the RNA extraction from IVT reactions section in Materials and Methods). The concentration of variant 1 was too low for Qubit quantification. c, The samples measured in b were run on an urea-polyacrylamide gel and stained with SYBR gold. Titration of an RNA standard of a similar length was performed to determine the linear range of band peak area quantified by Fiji–ImageJ56. d, A calibration curve was constructed by plotting the peak area computed from Fiji–ImageJ quantification against the total amount of standard loaded. e, Using the calibration curve in d, the total amount of RNA for each variant was determined and compared to the measurements made by Qubit in b. Data in b are shown for n = 3 independent biological replicates each plotted as a point with the bar height representing the average. Error bars indicate the average of the replicates ± standard deviation. Data shown in c are a representative of n = 3 independent biological replicates. The uncropped, unprocessed gel image shown in c is available as Source Data.

