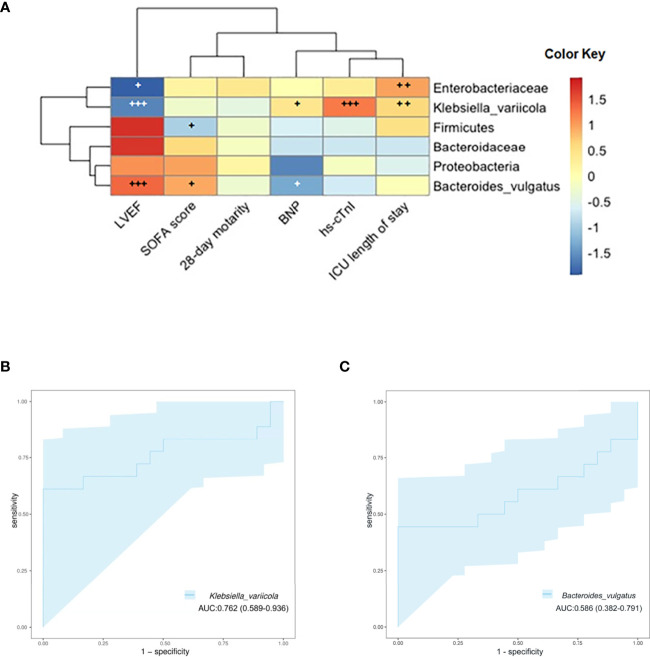
Figure 6.
(A) Associations of specific microbiota in different levels with clinical characteristics. The heat map of Spearman’s rank correlation coefficients between the gut microbiota and clinical indicators (+, p < 0.10; ++, p < 0.05; +++, p < 0.01; LVEF, left ventricular ejection fraction; SOFA, Sequential Organ Failure Assessment; BNP, brain natriuretic peptide; hs-cTnI, high-sensitivity cardiac troponin I). (B) ROC curve showing the ability of Klebsiella variicola to predict SIMD. (C) ROC curve showing the ability of Bacteroides vulgatus to predict SIMD. ROC, receiver operating characteristic; SIMD, sepsis-induced myocardial dysfunction.

