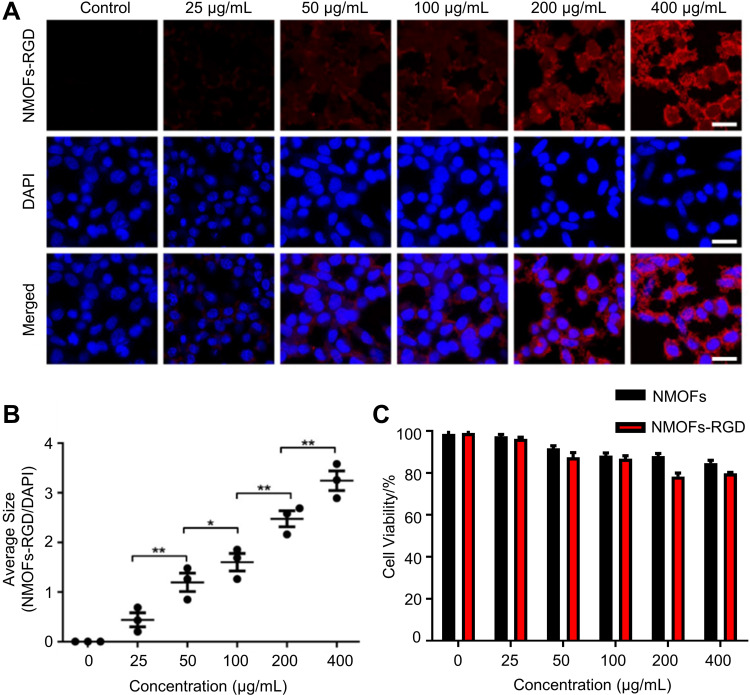
Figure 2.
In vitro fluorescence imaging and cytotoxicity of NMOFs-RGD. (A) Fluorescence images of HepG2 cells exposed to NMOFs-RGD. Red signals are from NMOFs-RGD. Note that NMOFs-RGD are localized at the membrane and in the cytoplasm. (B) Statistical analysis of fluorescence intensity in NMOFs-RGD-incubated cells (Student’s t-test; *P<0.05, **P<0.01). (C) Statistical analysis of cell viability in HepG2 cells incubated with NMOFs (control) and NMOFs-RGD. Scale bar in (A): 20 μm.

