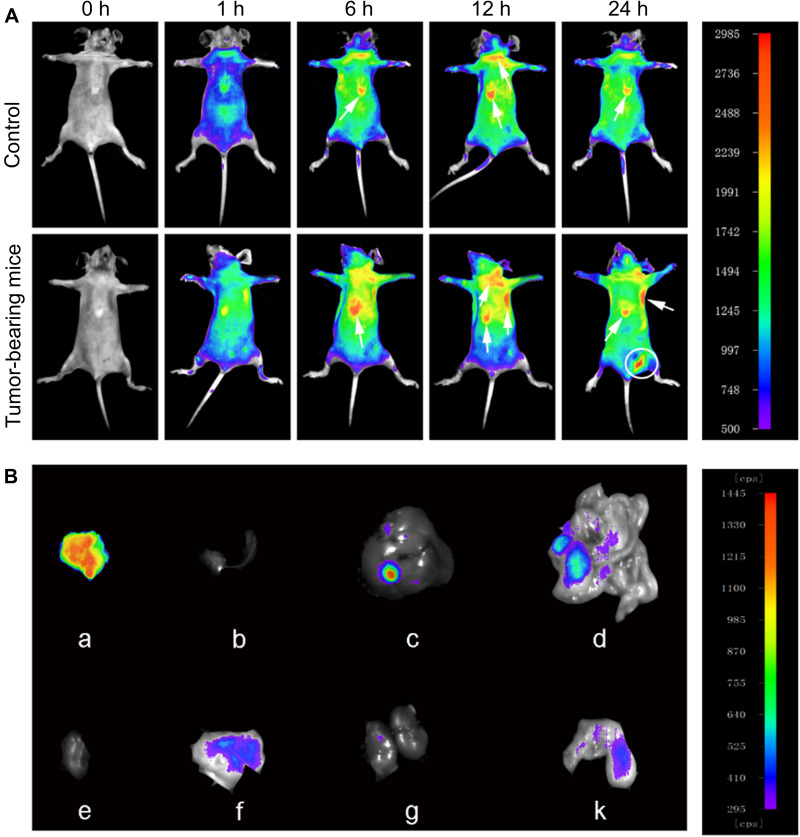
Figure 5.
Time-lapse distribution of NMOFs-RGD in tumor-bearing mice. (A) Thermal images of NMOFs-RGD in control and tumor-bearing mice at 0, 1, 6, 12, and 24 hours (h) postinjection. (B) Thermal images of NMOFs-RGD in different organs of tumor-bearing mice: (a) tumor, (b) spleen, (c) liver, (d) intestine, (e) heart, (f) stomach, (g) kidney, and (k) lung.

