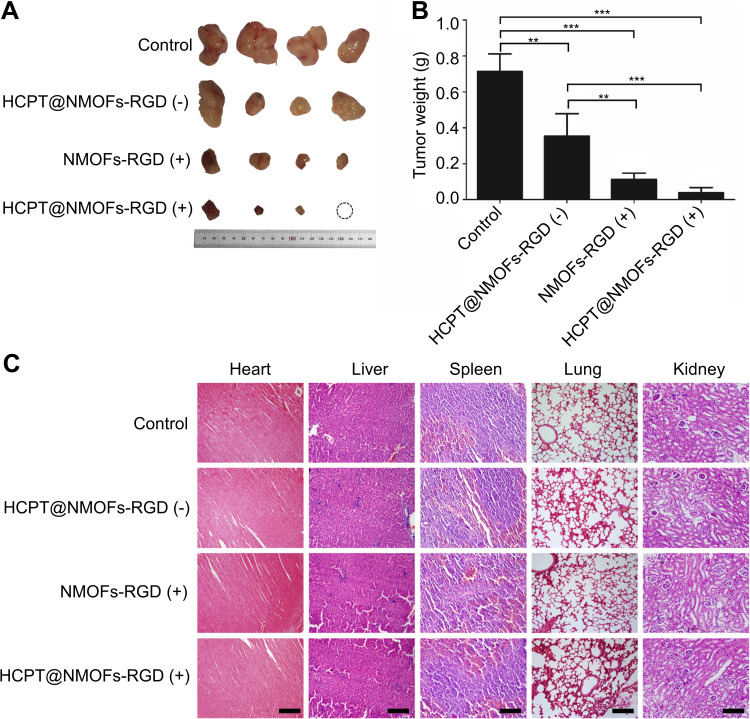
Figure 8.
The reduction of tumors in HCC-bearing mice following chemo-, photodynamic-, and synergistic therapy. (A) Images of tumors following different treatments at 12 days post treatment (dpt). Note that one tumor in the HCPT@NMOFs-RGD (+) group completely disappeared. (B) Statistical analysis of tumor weight at 12 dpt (ANOVA; **P<0.01, ***P<0.001). (C) Images of HE staining of the heart, liver, spleen, lung and kidney. “(+)” and “(−)” represent samples with or without laser irradiation at 655 nm, respectively. Scale bar in (C): 50 μm.

