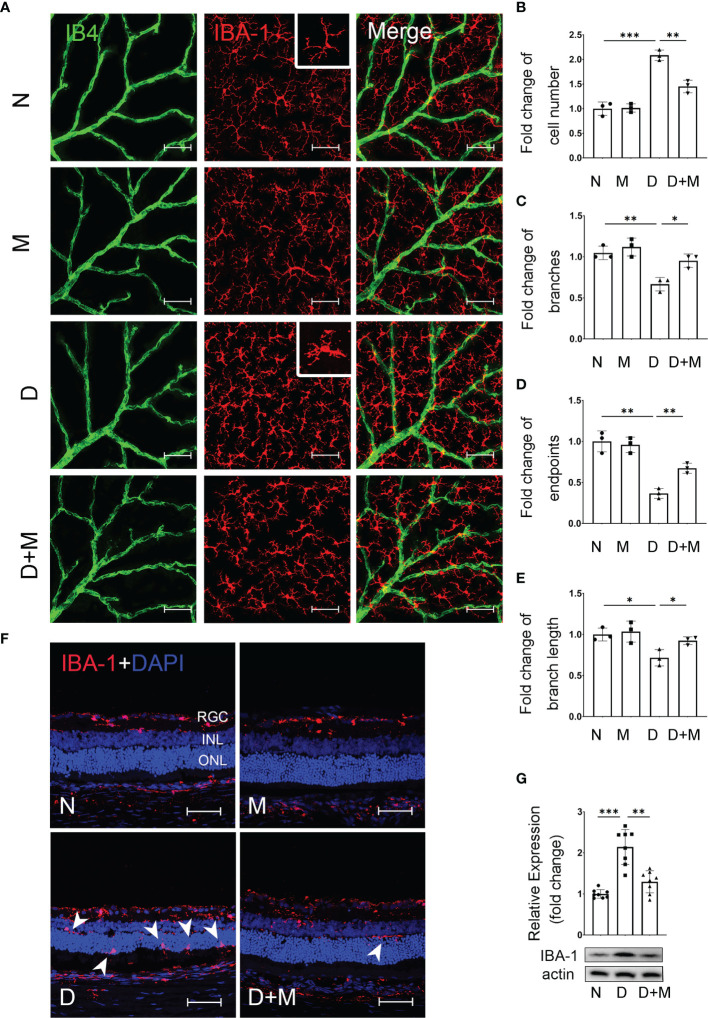
Figure 2.
Melatonin inhibits microglial activation in diabetic rat retinas. (A) Representative images of IBA-1 (red) and IB4 (green) immunolabeling in superficial capillary plexus of the retinal flatmounts in normal control and diabetic rat retinas with or without melatonin treatment. (B–E) Comparison of morphological changes in microglial number, cell branches, cell endpoints, and cell branch length in normal control and diabetic rat retinas with or without melatonin treatment. (F) Representative images of IBA-1 (red) and DAPI (blue) immunolabeling of retinal cryosections in normal control and diabetic rat retinas with or without melatonin treatment. Microglial migration is indicated by white arrowheads (n = 3 retinas per group). (G) IBA-1 protein expression in normal control and diabetic rat retinas with or without melatonin treatment. Data are expressed as mean ± SEM (n = 8 retinas per group). N, normal control group; M, melatonin treatment group; D, diabetes group; D+M, diabetes with melatonin treatment group; *p < 0.05, **p < 0.01, ***p < 0.001 by one-way ANOVA. Scale bar, 50 μm.

