Figure 5.
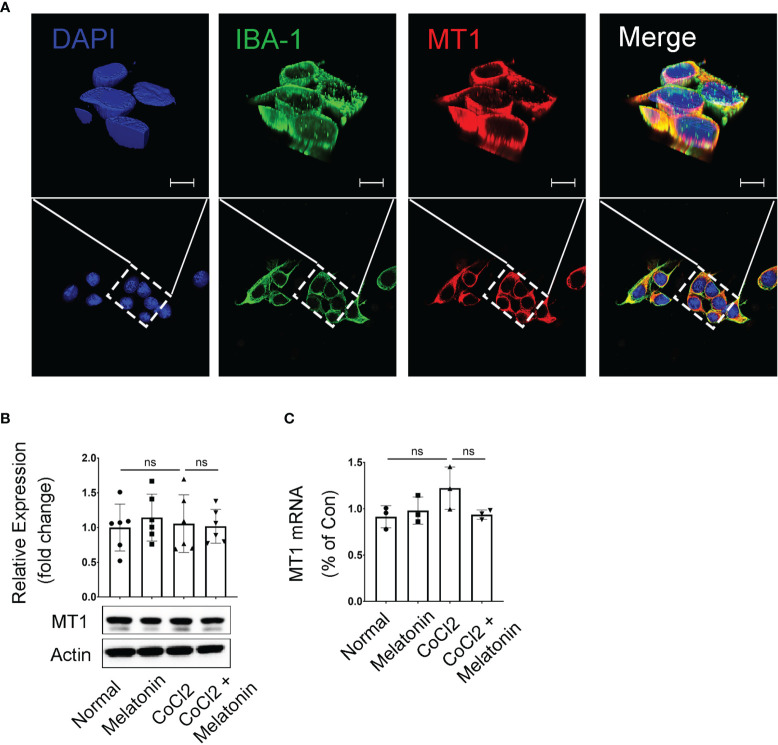
Melatonin receptor expression in CoCl2-treated BV2 cells. (A) Representative images of MT1 (red) and IBA-1 (green) immunostaining in microglia. Nuclei were stained with DAPI (blue). (B, C) MT1 proteins (n = 6 per group) and mRNA (n = 3 per group) expression in CoCl2-treated BV2 cells with or without melatonin treatment. Data are expressed as mean ± SEM. ns, non-significant difference. Scale bar, 10 μm.

