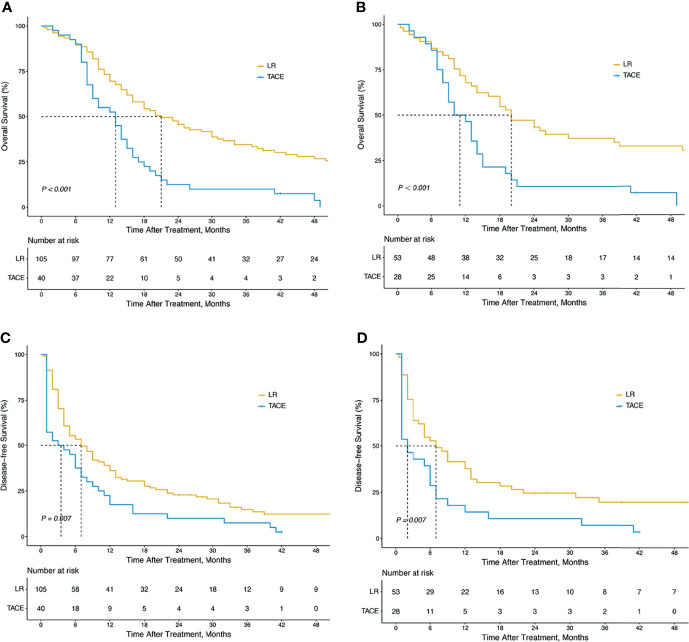
Figure 2.
Kaplan–Meier survival curves of OS and DFS in all HCC patients with BDTT. OS for HCC patients with BDTT in the LR and TACE groups (105 patients vs. 40 patients) before PSM (A) (P < 0.001); DFS in the LR and TACE groups (105 patients vs. 40 patients) before PSM (C) (P < 0.001); OS for HCC patients with BDTT in the LR and TACE groups (53 patients vs. 28 patients) after PSM (B) (P = 0.007); DFS in the LR and TACE groups (53 patients vs. 28 patients) after PSM (D) (P = 0.007). OS, overall survival; DFS, disease-free survival; HCC, hepatocellular carcinoma; BDTT, bile duct tumor thrombus; LR, liver resection; TACE, transcatheter arterial chemoembolization.

