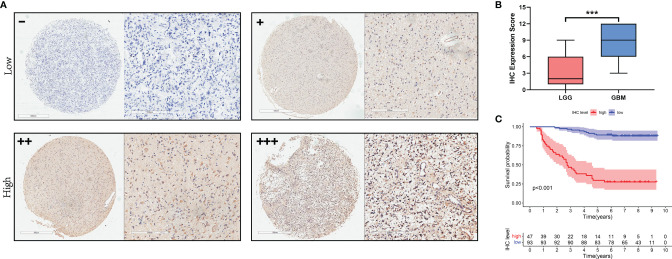
Figure 5.
The expression of NCAPG in glioma TMA. (A) The expression and distribution of NCAPG in representative tissue specimens. (B) The relationship between NCAPG expression and glioma grade in the tissue microarrays (TMA). (C) Survival curve and NCAPG expression in glioma TMA. (-: Negative for a score of 0, +: Weak for a score of 1-4, ++: Moderate for a score of 5-8, +++: Positive for a score of 9-12, ***P < 0.001).

