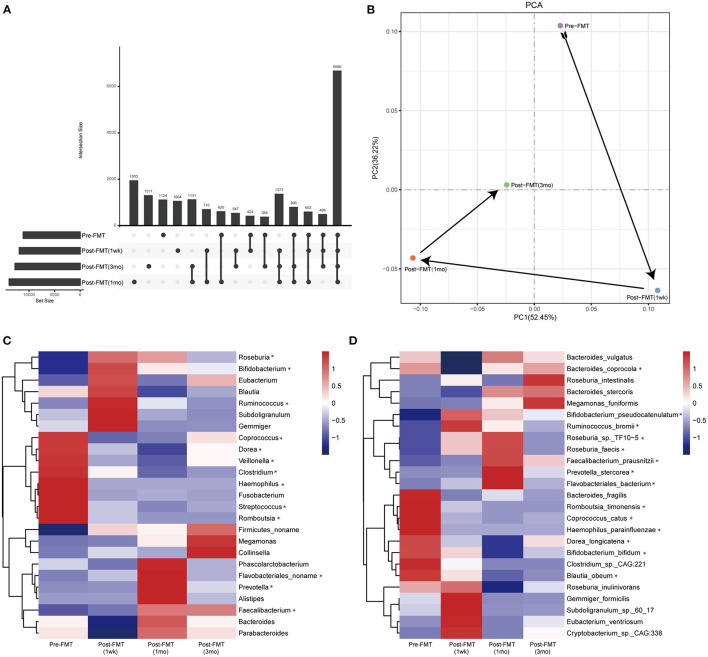
Figure 1.
Gut microbiota profiles before and after fecal microbiota transplantation (FMT). (A) Venn diagram; (B) principal component analysis. Relative abundance of the gut microbiota at the genus (C) and species (D) levels before and after FMT. *The change trend is the same as the clinical symptoms.

