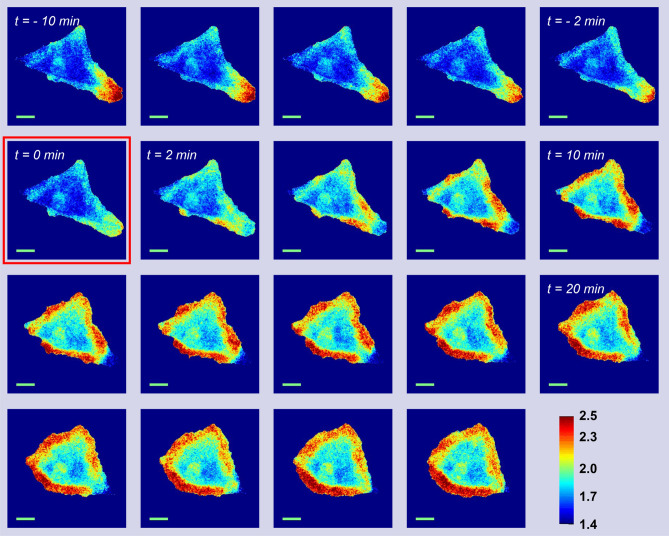
Figure 3.
Live-cell imaging of Rac1 biosensors. Representative image series of a HeLa cell co-expressing the FP Rac1 sensor with the 20 nm ER/K linker (transient transfection) and RapR-Src constructs (stable transfection) was imaged at two-minute intervals. The first image obtained following rapamycin addition (500 nM) is indicated by the square (at t = 0). The montage shows FRET/mCerulean ratio images with warmer colors reflecting higher localized Rac1 activity.

