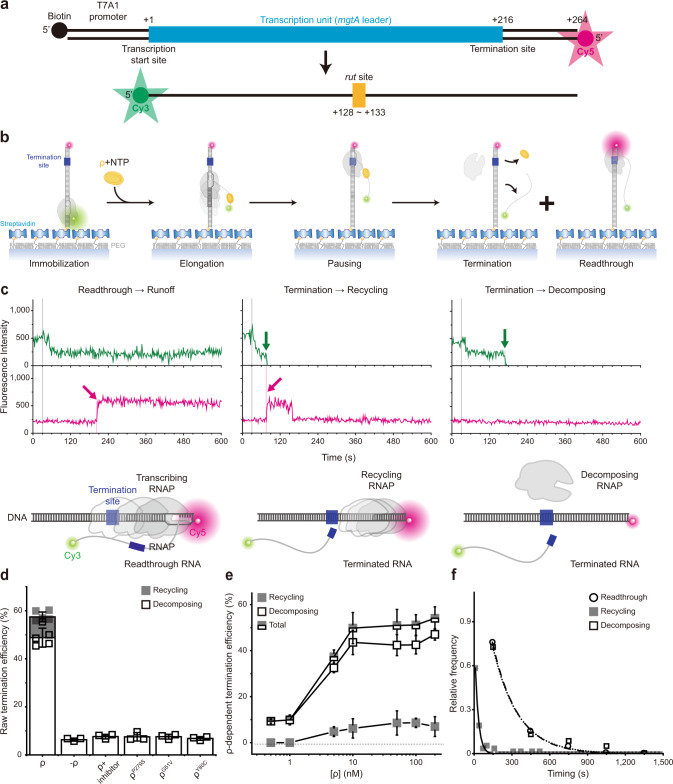
Fig. 1. Single-molecule assay of ρ-dependent termination.
a Transcription of a fluorescent Cy5-labeled DNA template with a ρ-dependent mgtA terminator produces RNA transcripts containing a rut site and labeled with fluorescent Cy3 at the 5′ end. b Scheme of single-molecule holistic assay of transcription termination. The occurrence of Cy3 and Cy5 PIFEs are indicated by enlarged green and magenta circles, respectively. c Three distinct patterns of fluorescence changes in active transcription. Readthrough (left, n = 251 complexes), recycling termination (center, n = 51), and decomposing termination (right, n = 289) are distinguished by their characteristic patterns in fluorescence time traces of Cy3 (green) and Cy5 (red) at Cy3 excitation (top) and Cy5 excitation (bottom). NTP + ρ were injected at 30 s (gray lines) after fluorescence monitoring starts. A schematic diagram is shown below each representative trace, and additional details are described in Supplementary Fig. 3. d Termination efficiencies (TEs) and background termination. Raw TEs are estimated as the ratio of decomposing or recycling events to the sum of all termination and readthrough events. Negative controls were performed without ρ or with ρ plus ρ-inhibitor bicyclomycin, and three ρ mutants exhibit only background levels of termination activity. e ρ-dependency of termination. The ρ-dependent TEs of recycling (solid) and decomposing (open) along with their sums (total) in the y-axis are plotted against input ρ concentrations on a base-10 log scale in the x-axis. ρ-dependent TEs are calculated by subtraction of the ρ-independent background TE (6.3%) from raw TEs. f Relative frequencies of readthrough, recycling termination, and decomposing termination timings. Termination was timed as the delay from Cy3 PIFE diminishing to Cy3 vanishing, whereas readthrough was timed as the delay from Cy3 PIFE diminishing to Cy5 PIFE starting. These timings were estimated with the data fitting to single exponential functions. Error bar represents the standard deviation of the mean from n ≥ 3 independent experiments. The numbers of analyzed molecules for d and e are in Supplementary Table 2. Source Data file includes the data for (d–f).

