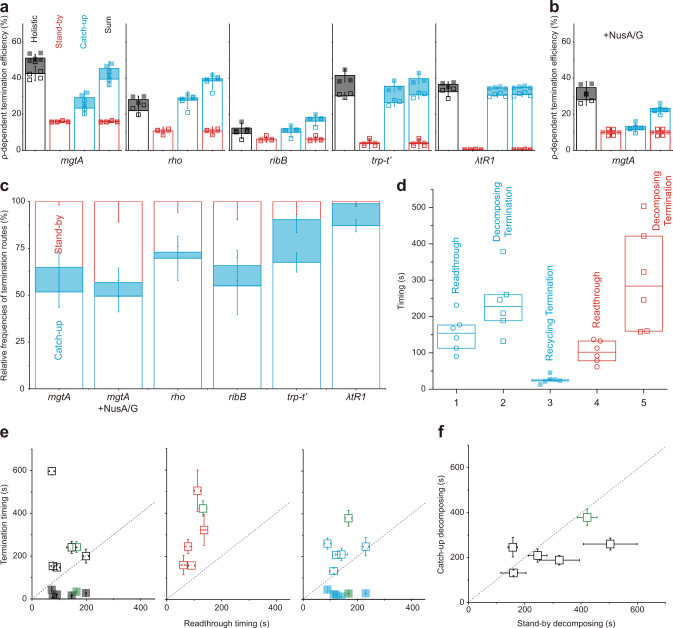
Fig. 4. Generality of ρ-dependent termination route heterogeneity.
Recycling (solid) and decomposing (open) terminations were counted and timed with each of the five terminators in holistic (black), stand-by (red), and catch-up (cyan) assays. a ρ-dependent TEs measured in the three different assays. The ρ-dependent TEs in catch-up and stand-by assays are summed in the rightmost bars for comparison with the holistic measurements in the leftmost bars. b The same as in a but for mgtA terminator with NusA/G. c Relative frequencies of the three termination routes. With each terminator, the frequency of each termination route in total termination events was estimated using the data in (a) and (b). The catch-up → decomposing route is the most frequent with every terminator. d Relative timings of readthrough and termination. For each transcription route with ρ, a box plot is drawn with readthrough or termination timings observed in all terminators in (a) and (b) (n = 6), their median (centerline), and the first and third quartiles (boundaries). When the timing distributions are compared among the five transcription routes, the catch-up ρ’s recycling termination is the earliest. e Comparison between termination and readthrough timings. The average termination timings of all terminators in the y-axis are plotted against the average readthrough timings in the x-axis. The data of mgtA with NusA/G are colored green. All open squares (decomposing termination) are located above the diagonal eye-guide line with a unit slope (dotted), and all solid squares (recycling termination) below the guideline. f Comparison of decomposing termination timings between catch-up and stand-by modes. The average timings of decomposing termination by catch-up ρ in the y-axis are plotted against those by stand-by ρ in the x-axis. All open squares are located below the guideline, except for rho terminator slightly above the line. Error bar represents the standard deviation of the mean from n ≥ 3 independent experiments. The numbers of analyzed molecules for (a) and (b) are in Supplementary Table 2. Values and statistics of timings for d–f are in Supplementary Tables 3 and 4. Source Data file includes the data for (a–f).

