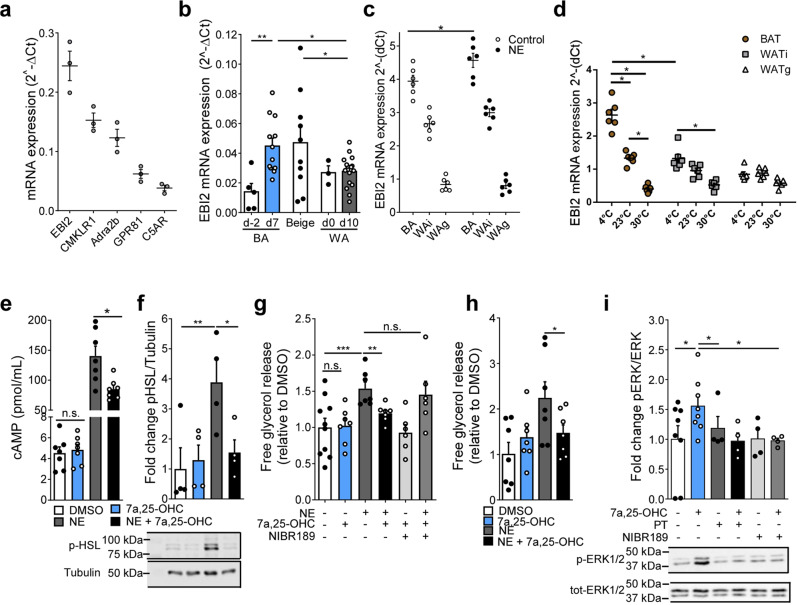
Fig. 1. The effect of EBI2 stimulation on brown adipocytes and adipose tissues.
a Ebi2 and other highly expressed Gi-coupled GPCRs mRNA expression in murine brown adipocytes (n = 3 independent cultures). b Ebi2 mRNA levels in pre and mature brown (BA), beige and white (WA) adipocytes (n = 5 independent experiments). c Ebi2 mRNA levels in BA, WAi, and WAg upon NE (1 µM) treatment (n = 6 independent experiments). d Ebi2 mRNA levels in BAT, WATi and WATg following exposure to 4 °C, 23 °C and 30 °C (n = 6 mice per condition). e Intracellular cAMP levels in brown adipocytes treated with NE (1 µM) and 7α,25-OHC (0.1 µM) (n = 7 independent samples). f p-HSL representative immunoblot and relative quantification in brown adipocytes treated with NE (1 µM) and 7α,25-OHC (1 µM) (n = 4 independent experiments). g Relative lipolysis of brown adipocytes treated with NE (1 µM), 7α,25-OHC (1 µM) and NIBR189 (10 µM) (n = 6 independent samples). h Relative lipolysis of hMADs treated with NE (1 µM) and 7α,25-OHC (1 µM) (n = 7 independent experiments). i p-ERK/ERK representative immunoblot and quantification from brown adipocytes treated with 7a,25-OHC (1 µM), pertussis toxin (PT, 200 nM) and NIBR189 (10 µM) (n = 4 independent experiments) Mean ± s.e.m., one-way ANOVA with Tukey post-hoc test and Student’s t test, *p < 0.05, **p < 0.01, ***p < 0.001.

