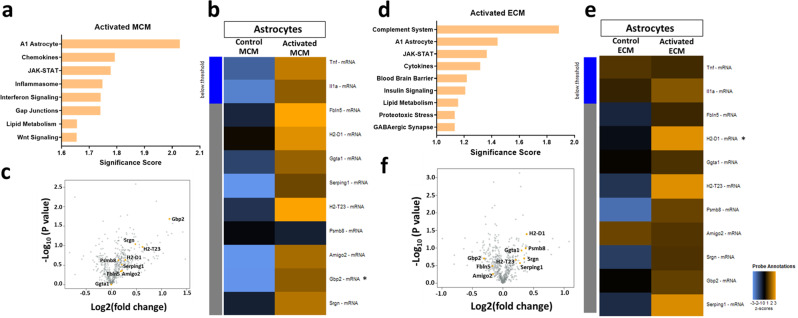
Fig. 3. Endothelial activated astrocytes adopt an A1-like astrocytic profile.
a NanoString Gene Set enrichment analysis significance scores of astrocytes treated with activated MCM vs. control MCM b Unsupervised clustering of global undirected significance score of A1 astrocytic genes of activated MCM vs. control MCM treated astrocytes c Volcano plots showing directed differentially expressed genes in activated MCM vs. control MCM-treated astrocytes d NanoString Gene Set enrichment analysis significance scores of astrocytes treated with activated ECM vs. control ECM e Unsupervised clustering of global undirected significance score of A1 astrocytic genes in activated ECM vs. control ECM treated astrocytes. f Volcano plots showing directed differential expression of activated ECM vs. control ECM treated astrocytes. n = 3. In b and e, asterisks indicate significant differences, where *P < 0.05 by Mann-Whitney test. Due to the small sample size and exploratory purpose, statistical significance is reported by raw p values, and is not corrected by FDR.

