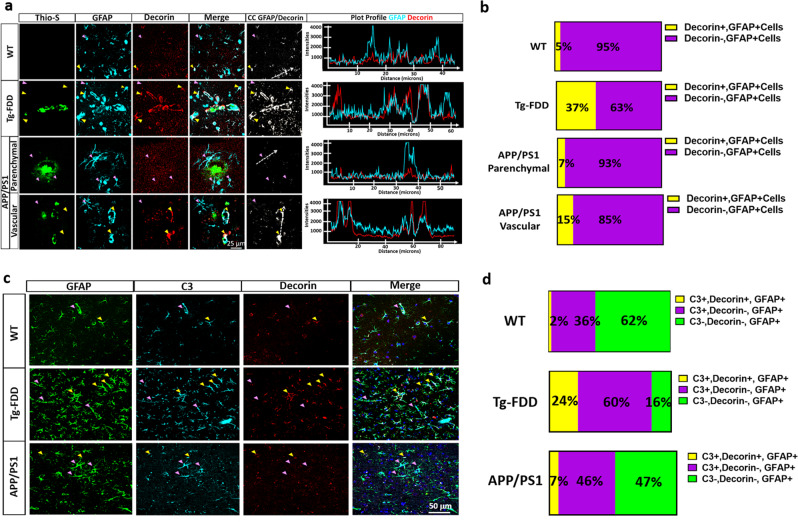
Fig. 6. Decorin+ astrocytes are associated with vascular amyloid in vivo.
a Triple immunofluorescence of amyloid (Thio-S, green), astrocytes (GFAP, cyan), and Decorin (red) in the cortex of 15-month-old Tg-FDD, APP/PS1 mice and WT controls. Major presence of Decorin immunoreactivity is observed in the perivascular region of Thio-S positive vasculature in Tg-FDD mice. Yellow arrows indicate Decorin+, GFAP+ cells and purple arrows indicate Decorin-, GFAP+ cells. Colocalization analysis (CC) was performed to determine pixel intensity correlation between GFAP and Decorin. White pixels indicate colocalization between GFAP and Decorin signal and white dashed arrows represent distance in plot profiles showing overlapping intensities of astrocytes (GFAP, cyan) and Decorin (red). b Quantification of the proportion of Decorin+ cells in Tg-FDD, APP/PS1 and WT mice. c Triple immunofluorescence of astrocytes (GFAP, green), complement component 3 (C3, cyan), and Decorin (red) in the cortex of 15-month-old Tg-FDD and APP/PS1 mice. Yellow arrows indicate C3+, Decorin+, GFAP+ cells and purple arrows indicate C3+, Decorin-, GFAP+ cells. d Quantification of the proportion of C3+Decorin+ astrocytes versus C3+ astrocytes in Tg-FDD, APP/PS1 and WT mice. For quantifications, eight to ten images were used for each experiment (n = 3), and 200 cells were counted. All are representative images of 15-month-old Tg-FDD, APP/PS1 or WT mice. Scale bar 25 or 50 μm, respectively.

