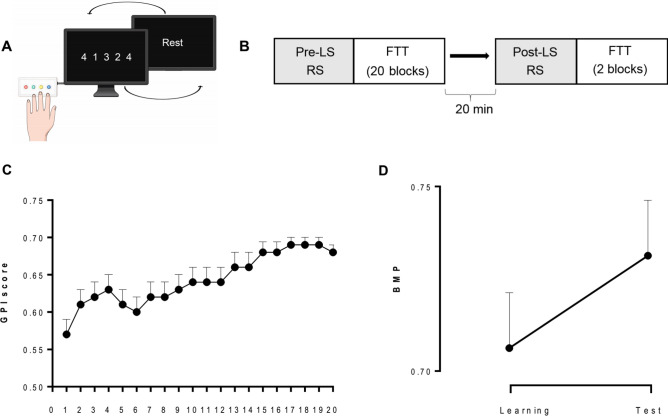
Figure 1.
Experimental design and behavioural performance. (A) Schematic illustration of the FTT sequence to be reproduced during 30-s experimental blocks designed using Mind The Graph platform, https://mindthegraph.com. (B) Experimental procedure: MEG recorded pre-learning session (LS) resting state (RS; 5 min eyes open), immediately followed by 20 FTT training blocks. After a 20-min break, MEG recorded post-learning RS followed by 2 FTT blocks (Test). (C) Global Performance Index (GPI) evolution across the 20 FTT blocks during LS. (D) Offline changes from the best motor performance (BMP) at learning to the best performance at testing. Error bars are standard errors. Figures (C) and (D) were created using GraphPad Prism version 9.1.2, GraphPad Software, San Diego, California USA, www.graphpad.com.

