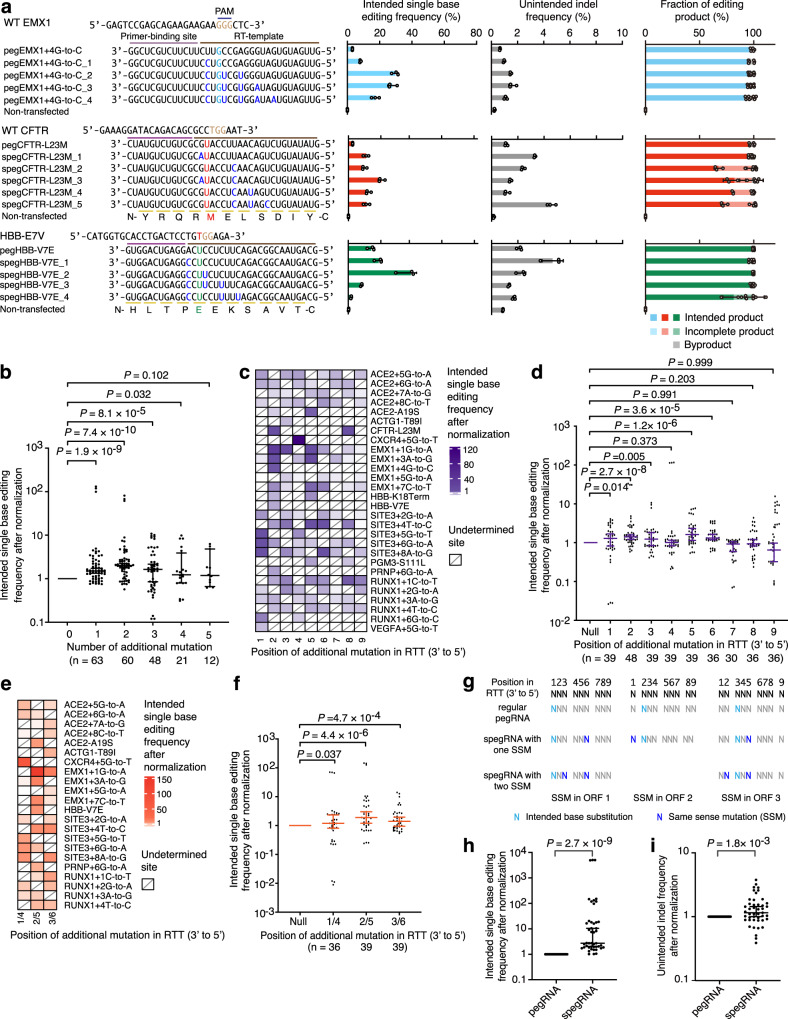
Fig. 1. pegRNA containing additional base substitutions induced higher efficiencies of intended single-base editing.
a Sequences of PBS and RTT of pegRNAs. Intended single-base edits are in cyan, red (pathogenic mutations), or green (corrected base), additional base substitutions are in blue and protospacer adjacent motifs (PAMs) are in brown. The intended single-base editing frequency, unintended indel frequency and fraction of editing product were induced under PE3 setting. Means ± s.d. are from three independent experiments. b Statistical analysis of normalized single-base editing frequencies, setting the frequencies induced by regular pegRNAs (without additional base substitution) as 1. n = intended single-base editing from three independent experiments in a and Supplementary Figs. 1b and 2b, f. c Heatmaps show the normalized single-base editing efficiencies induced by the pegRNAs with one additional base substitution, setting the ones induced by regular pegRNAs as 1. d Statistical analysis of normalized single-base editing frequencies, setting the frequencies induced by regular pegRNAs as 1. n = intended single-base editing from three independent experiments in c. e Heatmaps show the normalized single-base editing efficiencies induced by the pegRNAs with two additional base substitutions, setting the ones induced by regular pegRNAs as 1. f Statistical analysis of normalized single-base editing frequencies, setting the frequencies induced by regular pegRNAs as 1. n = intended single-base editing from three independent experiments in e. g The strategy to design efficient spegRNAs, depending on the relative positions between the ORF of edited gene and the 3’-end of RTT. h, i Statistical analysis of normalized single-base editing frequencies (h) and unintended indel frequencies (i) induced by the pegRNAs designed according to the rule shown in g, setting the frequencies induced by regular pegRNAs as 1. n = 45 intended single-base editing (h) and unintended indel editing (i) from three independent experiments in Supplementary Fig. 10. The data in c and d are from a and Supplementary Figs. 1b, 2b, e, and 8a. The data in e and f are from a and Supplementary Figs. 1b, 2b, e, and 8b. b, d, f, h, i P value, Wilcoxon one-tailed signed-rank test. The median and interquartile range (IQR) are shown. Source data are provided as a Source Data file.

