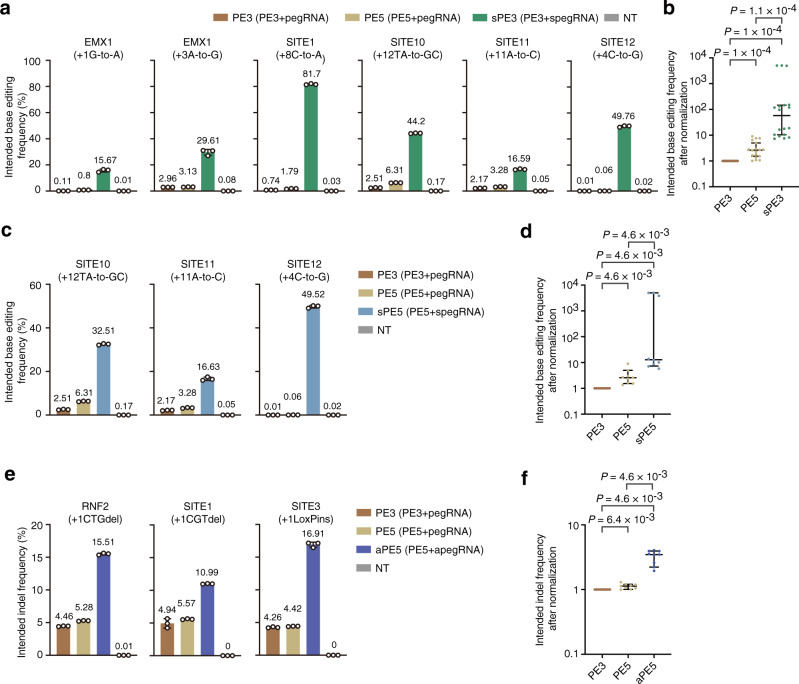
Fig. 3. Comparison and combination of PE5, spegRNA, and apegRNA.
a Comparison of PE5 with spegRNA. The intended base editing frequencies were induced by PE3, PE5, and sPE3 (PE3 with spegRNA) at the indicated target sites. b Statistical analysis of normalized base editing frequencies induced by PE3, PE5, and sPE3, setting the frequencies induced by PE3 as 1. n = 18 intended base editing from three independent experiments in a. c Combination of PE5 and spegRNA. The intended base editing frequencies were induced by PE3, PE5, and sPE5 (PE5 with spegRNA) at the indicated target sites. The data for PE3 and PE5 are same as the ones in a. d Statistical analysis of normalized base editing frequencies induced by PE3, PE5, and sPE5, setting the frequencies induced by PE3 as 1. n = 9 intended base editing from three independent experiments in c. e Combination of PE5 and apegRNA. The intended indel frequencies were induced by PE3, PE5, and aPE5 (PE5 with apegRNA) at the indicated target sites. f Statistical analysis of normalized intended indel frequencies induced by PE3, PE5, and aPE5, setting the frequencies induced by PE3 as 1. n = 9 intended indel editing from three independent experiments in e. a, c, e Means ± s.d. are from three independent experiments. b, d, f P value, Wilcoxon one-tailed signed-rank test. The median and interquartile range (IQR) are shown. Source data are provided as a Source Data file.

