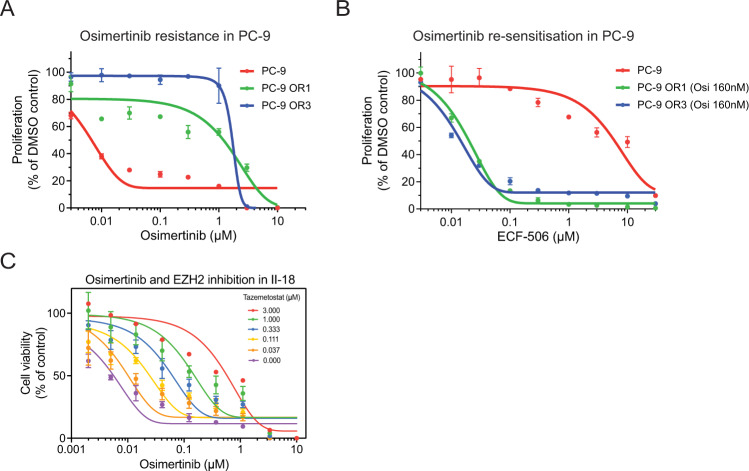
Fig. 6. Validation of SRC and EZH2 as resistance drivers proposed by recommendation system.
A Osimertinib dose–response curve in PC9 parental cells compared to two lines derived to have acquired osimertinib resistance, as measured by Cell Titer Glo (96h treatment). B ECF-506 (SRCi) dose–response curve in PC9 parental vs. resistant lines, as measured by Cell Titer Glo (96 h treatment). Resistant cells were co-treated with 160 nM osimertinib. C Viability assay demonstrating dose-dependent effect of EZH2 inhibition on osimertinib resistance in II-18. OR = osimertinib (Osi) resistant. Data are presented as mean values +/– SD (n = 3) of a typical plot, where the experiment was repeated at least three times.

