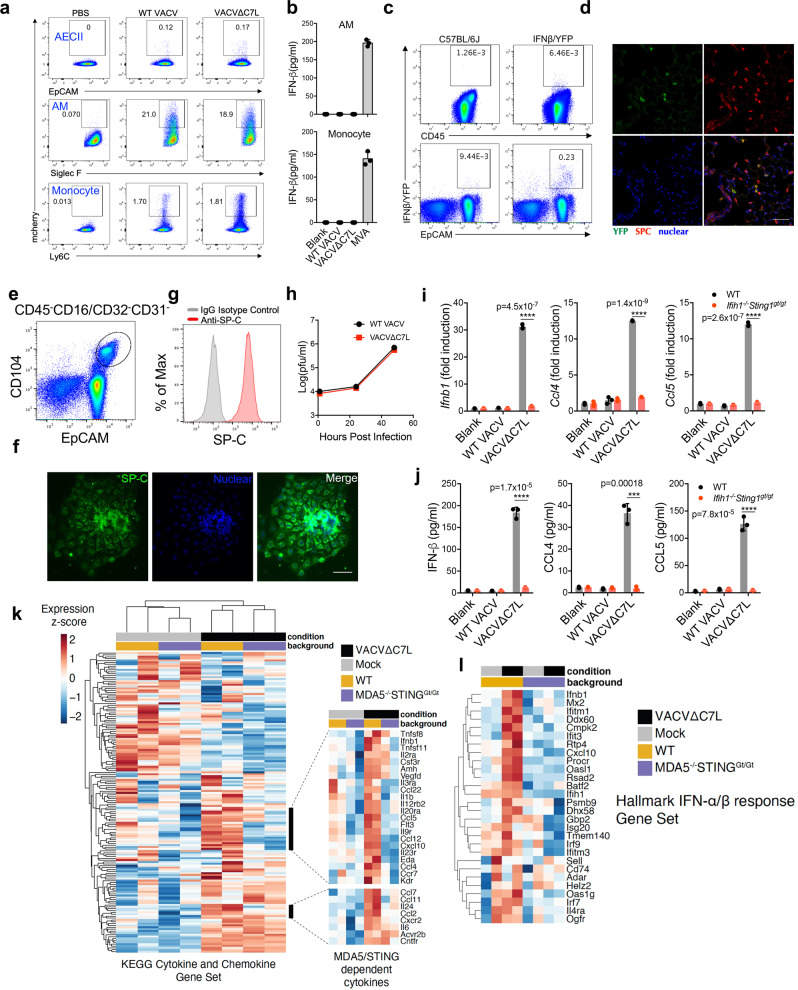
Fig. 2. Lung AECIIs produce IFN-β and induces IFN-stimulated genes upon VACV∆C7L infection in a MDA5/STING-dependent manner.
a Dot plots showing percentages of mCherry-positive cells among AMs (Siglec F+CD11c+), AECIIs (CD45−CD31−T1a−Sca1−EpCAM+) and monocytes (Ly6C+CD11b+) in VACV-mCherry, VACV∆C7L-mCherry-infected lungs from WT C57BL/6J mice at day 1 post infection. b ELISA analyses of IFN-β levels in the supernatants of AMs or monocytes isolated from naïve WT C57BL/6J mice infected with viruses at a MOI of 5 for 24 h. c Dot plots showing percentages of IFNβ/YFP positive cells among CD45+ cells and CD45−EpCAM+ lung epithelial cells in VACV∆C7L-infected lungs from Ifnb1Eyfp and WT C57BL/6J mice determined by FACS. d Representative confocal images showing expression pattern of IFNβ-secreting cells in lungs from Ifnb1Eyfp mice infected with VACV∆C7L collected at day 1 post infection. Top left: IFNβ-YFP+ cells (green); Top right: surfactant protein C (SPC) positive AECII (red); Bottom left: DAPI staining of nuclei (blue). Scale bar, 50 μm. e Gating strategy for the isolation of lineage negative epithelial progenitor cells that are CD45−CD16/CD32−CD31−EpCAM+CD104+. f Cells were cultured in on Matrigel-coated plates as described in methods. The identify of AECII cells were confirmed by SPC+ staining. Scale bar, 500 μm. g FACS analysis of SPC expression from cultured AECII cells. h Viral growth curve in cultured AECII cells at an initial MOI of 0.05. i RT-PCR of Ifnb1, Ccl4, and Ccl5 gene expression of cultured AECII cells from WT or Ifih1−/−Sting1gt/gt mice infected with viruses at a MOI of 5 for 12 h. j ELISA of IFN-β, CCL4, CCL5 levels in the supernatants of AECII from WT or Ifih1−/−Sting1gt/gt mice infected with viruses at a MOI of 5 for 24 h. k Heatmap of RNAseq showing relative expression of cytokine and chemokines genes between WT AECII and Ifih1−/−Sting1gt/gt AECII cells. l Heatmap of representative type I IFN related differentially expressed genes between WT AECII and Ifih1−/−Sting1gt/gt AECII cells. Two-tailed unpaired Student’s t test was used for comparisons of two groups in the studies. ***p < 0.001 and ****p < 0.0001. Data are representative of one k–l, or three a–j independent experiments and presented as mean ± SD. Source data are provided as a Source Data file.

