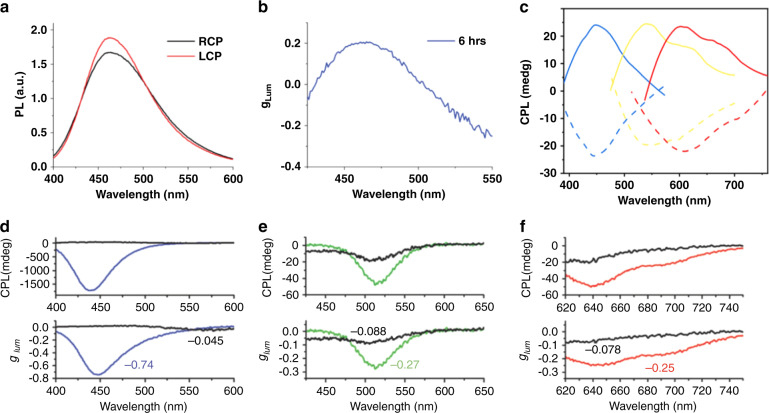
Fig. 6. CPL in chiral carbon dots.
a PL spectra of carbon-dot/cellulose nanocrystals, recorded using left- and right-handed circular polarizers (LCP and RCP, respectively) and b their gLum plotted as a function of emission wavelength. c CPL spectra of superstructures of blue, yellow, and red chiral carbon dots and glutamic diamide (solid and dotted lines show spectra of enantiomers). d–f CPL spectra and gPL of cellulose nanocrystals and blue (d), green (e), and red (f) carbon dots from the carbon-dot/cellulose nanocrystal composites. Colored lines show photonic band gap superimposed on emission band; black lines show photonic band gap not overlapping with emission band. a, b Adapted with permission from63 Copyright 2019 Wiley-VCH GmbH. c Adapted with permission from59 Copyright 2021 Wiley-VCH GmbH. d–f Adapted with permission from64 Copyright 2018 Wiley-VCH GmbH

