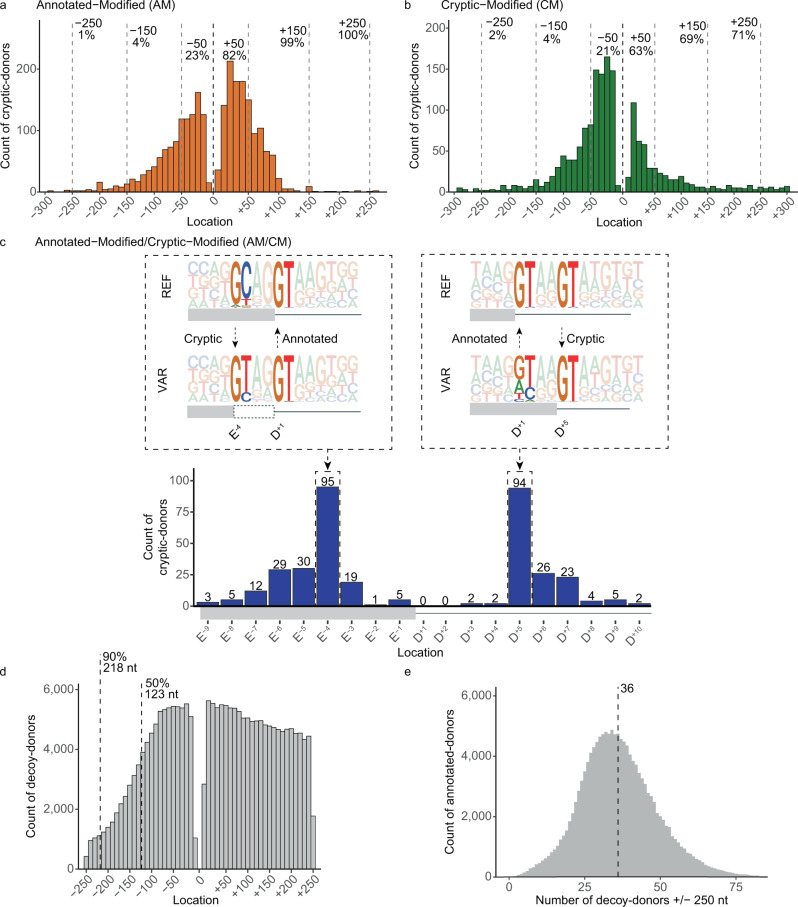
Fig. 2. Cryptic-donor activation is influenced by proximity to the annotated-donor.
a, b Distribution of cryptic-donors activated by (a) AM-variants and (b) CM-variants. Location (x-axis) denotes the distance of the cryptic-donor from the annotated-donor, with negative values upstream into the exon and positive values downstream into the intron. c (Bottom) Distribution of cryptic-donors activated by AM/CM-variants. (Top) Pictograms showing the Reference (REF) and Variant (VAR) sequences for AM/CM-variants. Activated cryptic-donors are prevalent at E-4 (left) and D+5 (right) due to conserved GTs at D+1/+2 and D+5/+6 of the conserved donor splice-site sequence. d Frequency of naturally occurring decoy-donors (any GT or GC) +/− 250 nt of annotated-donors in the human genome. Dashed lines indicate the 50th and 90th percentile for exon length. The decline in exonic donors is due to relatively fewer longer exons. e Distribution of the number of decoy-donors in the +/−250 nt surrounding each annotated-donor in the human genome. Dashed line shows that there are an average of 36 decoy-donors within 250 nt of each annotated-donor.

