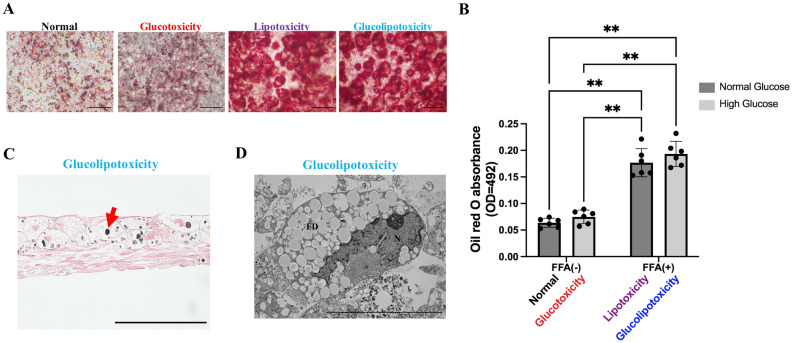
Figure 4.
Evaluation of fat drop. (A) Representative images of oil red O staining. Scale bar, 200 μm. (B) Quantification of oil red O staining. Lipotoxicity and glucolipotoxicity groups showed significantly more oil red O accumulation than control and glucotoxicity groups, n = 6, 3 independent experiments, **p < 0.01. (C) Representative images of fat drops (Osmium method). Red arrow indicates fat drop. Scale bar, 100 μm. (D) Representative images of TEM. Fat accumulation was observed in the glucolipotoxicity group. Scale bar, 10 μm. N: nuclear, FD: fat drops.

