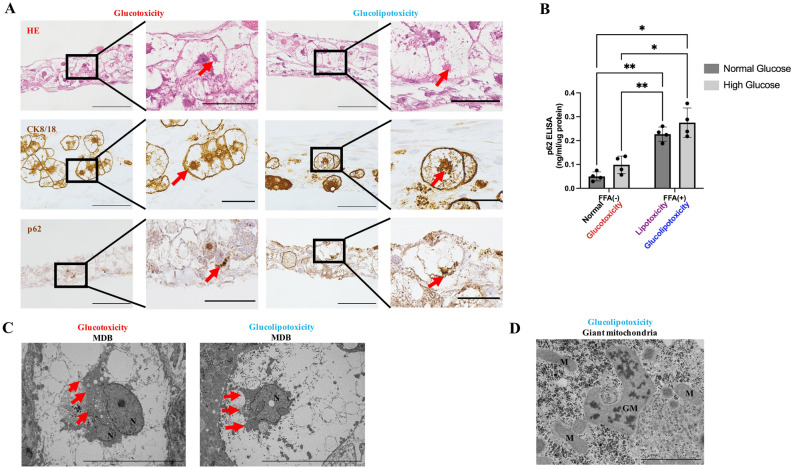
Figure 5.
Identification of MDBs in vitro. (A) Representative images of HE staining and immunofluorescence staining. Eosinophilic bodies and CK8/18 aggregates were observed in glucotoxicity, lipotoxicity, and glucolipotoxicity groups. However, p62-positive bodies were identified only in the glucotoxicity and glucolipotoxicity groups. Red arrows indicate MDBs. Scale bar, 100 μm in normal views. Scale bar, 50 μm in enlarged views. HE: Hematoxylin–eosin, CK: Cytokeratin. (B) p62 protein quantification in PHH/HSC sheets by ELISA. p62 levels were significantly higher in the lipotoxicity and glucolipotoxicity groups compared to control and glucotoxicity groups. n = 4, 3 independent experiments, **p < 0.01, *p < 0.05. (C) Representative images of TEM. Red arrows indicate MDBs. MDBs were observed in the glucotoxicity and glucolipotoxicity groups. Scale bar, 10 μm. N: nuclear. (D) Representative images of TEM. Giant mitochondria was observed in the glucolipotoxicity group. Scale bar, 2 μm. M: mitochondria, GM: giant mitochondria with crystalline inclusion.

