Figure 6.
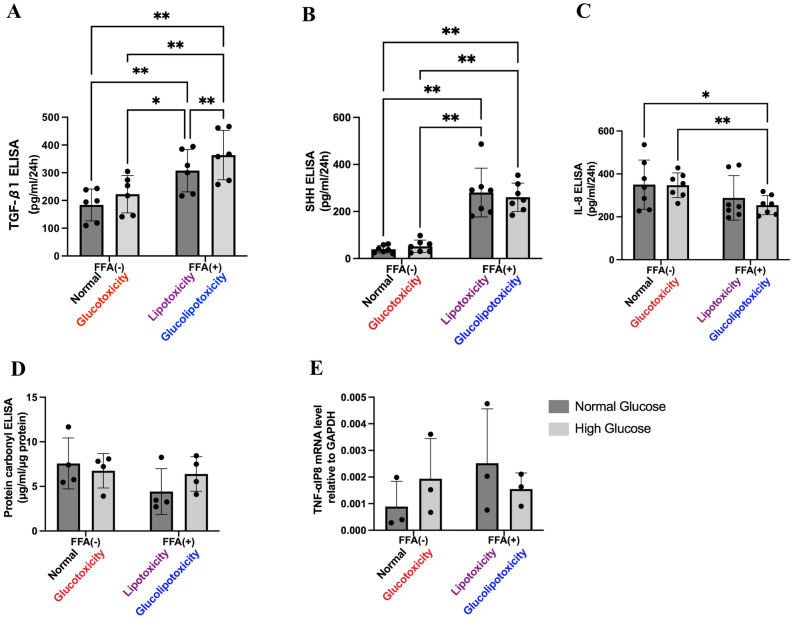
Functional analyses. (A) Evaluation of TGF-β1 levels in culture supernatant by ELISA. TGF-β1 levels were significantly higher in lipotoxicity and glucolipotoxicity groups compared to control and glucotoxicity groups. n = 6, 3 independent experiments, **p < 0.01, *p < 0.05. (B) Evaluation of SHH levels in culture supernatants by ELISA. SHH levels were significantly higher in lipotoxicity and glucolipotoxicity groups compared to control and glucotoxicity groups. n = 7, 3 independent experiments, **p < 0.01, *p < 0.05. SHH: Sonic hedgehog. (C) Evaluation of IL-8 levels in culture supernatant by ELISA. IL-8 levels were significantly higher in the lipotoxicity and glucolipotoxicity groups compared to control and glucotoxicity groups. n = 6, 3 independent experiments, **p < 0.01 *p < 0.05. (D) Evaluation of protein carbonyl levels in PHH/HSC sheet lysates by ELISA. Protein carbonyl levels were not significantly different between groups. n = 4. (E) Evaluation of TNFα-IP8 mRNA expression in PHH/HSC sheets by RT-qPCR. GAPDH was used as normalizer. No significant difference was observed between groups. n = 3, 3 independent experiments.

