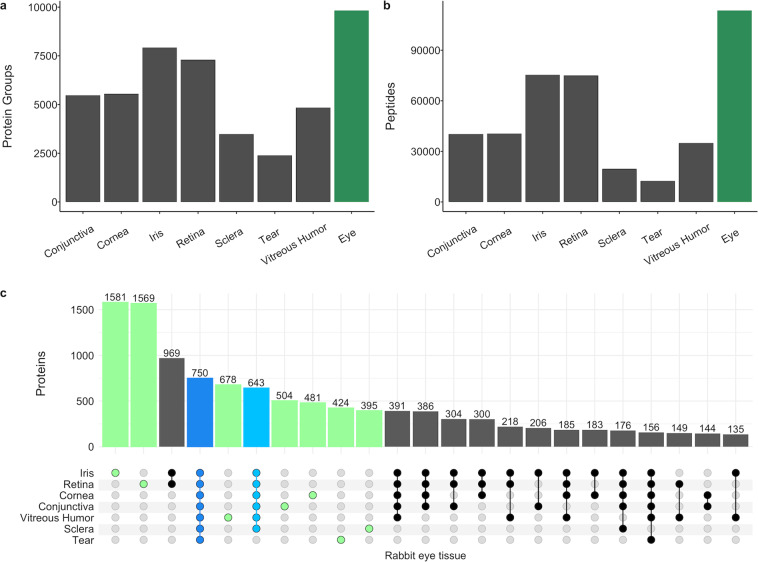
Fig. 1.
Spectral assay library characteristics. The number of proteins (a) and peptides (b) in each rabbit ocular tissue spectral assay library (dark gray) and the rabbit eye library (dark green). (c) Bar graph showing the overlaps and uniquely identified proteins in each category as denoted by the dot matrix. Each dot in solid colors except light gray represents proteins present in the corresponding ocular tissue shown at the left of the matrix. The number of proteins identified in all 7 ocular tissues is highlighted in blue, and the number of proteins identified in 6 ocular tissues (except tear) is highlighted in light blue. The number of proteins uniquely identified in each ocular tissue is highlighted in green.

