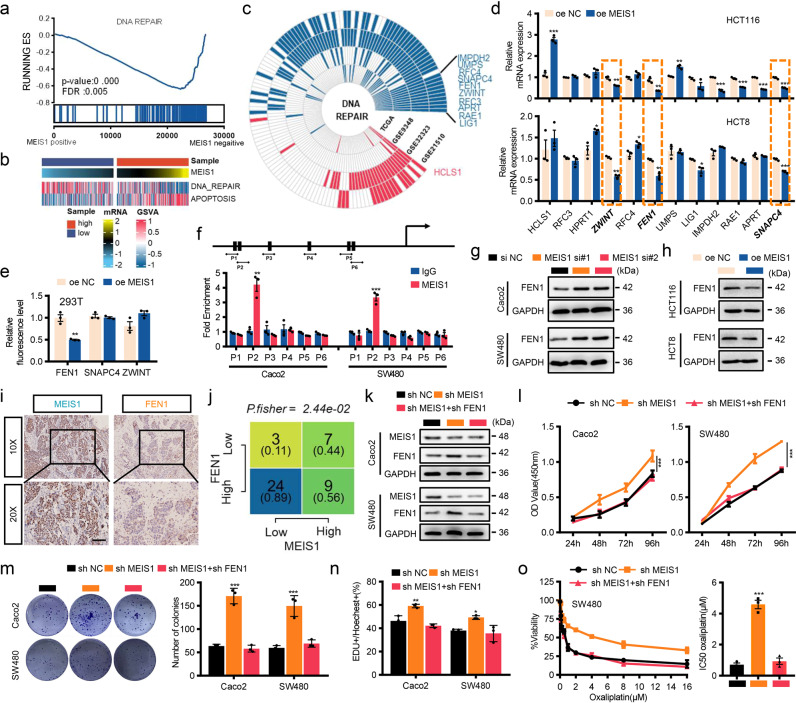
Fig. 4.
Oxaliplatin resistance following MEIS1 suppression is critically dependent on enhanced FEN1 expression. a GSEA plots showing that MEIS1 mRNA expression negatively correlated with DNA damage repair signatures in the TCGA datasets. b GSVA enrichment analysis showing the DNA repair and apoptosis pathways in the high- or low-MEIS1 groups. c Significant correlations were observed between MEIS1 expression and DNA damage repair pathway genes in the GSE9348, TCGA, GSE21510, and GSE32323 datasets. These genes were detected with | R | > 0.3 as the cutoff criterion in the four-cohort profile. Red represents positive correlations and blue represents negative correlations, Genes that were exclusively positive or negative correlations in all four datasets were screened as candidate genes. d qPCR results of the indicated RNA levels in cells transfected with oe-NC or oe MEIS1. e Luciferase reporter assay of the effect of FEN1, SNAPC4, and ZWINT on the transcriptional activity of the MEIS1 promoter. f Schematic showing putative MEIS1-binding sites on the promoter region of FEN1 and design of the indicated primers (top). ChIP-qPCR analysis of the enrichment of MEIS1 on the FEN1 promoter relative to that in control IgG-treated Caco2 and SW480 cells (bottom). g, h Representative western blot image of the FEN1 protein levels in cells with MEIS1 knockdown (g) or overexpression (h). i, j IHC of MEIS1 and FEN1 expression in CRC. Data are presented as a representative image (i) (top, ×20 magnification; bottom, ×40 magnification) and summary graphs(j). Scale bar, 100 µm. k Western blot analyses of MEIS1 and FEN1 expression in Caco2 and SW480 cells. l–n The proliferation of Caco-2 and SW480 cells was evaluated by the CCK-8 (l), cell colony formation (m), and EdU assays (n). o The cell viability and the IC50 values of SW480 cells was evaluated by the CCK-8 following increasing concentrations of oxaliplatin treatment for 48 h. The data are presented as the mean ± SEM from three independent experiments. *p < 0.05, **p < 0.01, ***p < 0.001

