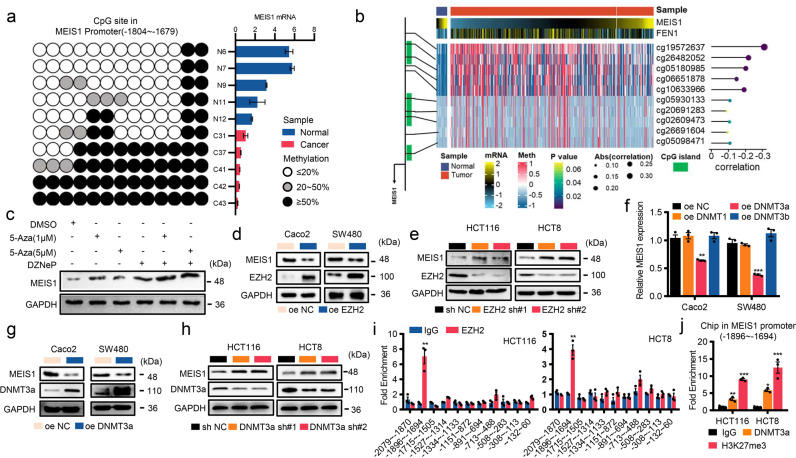
Fig. 5.
Epigenetic silencing maintained by the EZH2/DNMT3a complex contributes to suppressed transcription of MEIS1 in CRC. a BSP analysis of CpG methylation sites on the promoter region of MEIS1 in CRC tumor specimens. The color inside the circle represents the average CpG island methylation status obtained from five independent clones (left). The expression of MEIS1 was analyzed by qPCR (right). b Schematic showing the CpG islands of MEIS1 (left), CpG islands (green) and probes (black line). Heatmap with beta values of DNA methylation obtained from ten MEIS1 probes in normal colorectal tissues and CRC tumors from the TCGA 450K array (middle). Correlation analysis of MEIS1 probes and MEIS1 expression levels by the Pearson correlation coefficient (right). c Western blot analysis of MEIS1 expression in HCT116 cells treated with different combinations of epigenetic drugs. d, e Western blot analyses of EZH2 and MEIS1 expression in CRC cell lines transfected with EZH2 shRNA or oe-EZH2, and their corresponding controls. f qPCR analysis of MEIS1 mRNA levels in Caco2 and SW480 cells transfected with oe-NC, oe-DNMT1, oe-DNMT3a, or oe-DNMT3b. g, h Western blot of DNMT3a and MEIS1 expression in CRC cell lines transfected with DNMT3a shRNA, oe-DNMT3a, and their corresponding controls. i ChIP-qPCR analysis of the enrichment of EZH2 on the MEIS1 promoter relative to that of control IgG in HCT116 and HCT8 cells. j ChIP-qPCR analysis of the DNMT3a genomic occupancy and H3K27 methylation status at the MEIS1 promoter. Data are presented as the mean ± SEM from three independent experiments. *p < 0.05, **p < 0.01, ***p < 0.001

