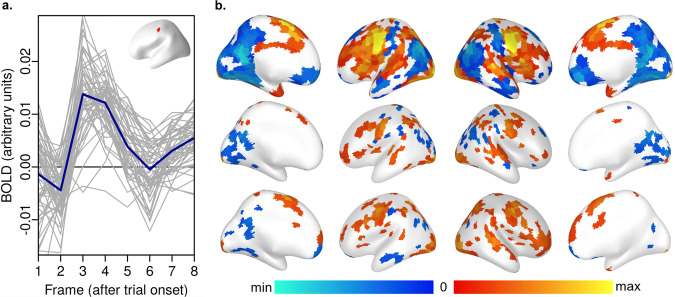
Fig. 10.
Parcel averages from a positive control “on-task” analysis (average BOLD after trial onsets), Stroop task. Panel a: Example parcel-average timecourses, which resemble the HRF. This is parcel 116, run 1; grey lines are individual participants, blue the group mean. Panel b: Average of frames 2-5 for each parcel; the top row is the group average, while the middle and bottom rows show two individual participants with representative differences from the mean (f5386yx, f5445nh run 1) lower. Code and additional examples in the controlAnalysis files17.

