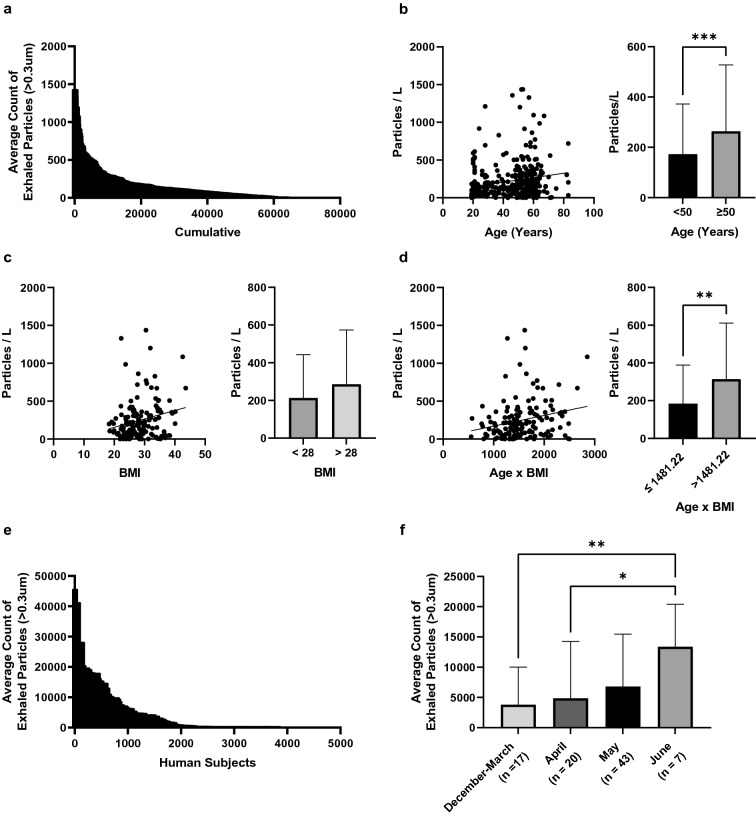
Figure 2.
Exhaled aerosol particle numbers among healthy and infected human subjects in Germany and India following normal tidal breathing. (A) Exhaled aerosol particle numbers for 357 healthy human subjects in Marburg Germany. (B) Exhaled aerosol particle numbers versus age, with median = 50 years. (C) Exhaled aerosol particle numbers versus BMI, with median = 28. (D) Exhaled aerosol particle numbers versus BMI-age, with median = 1481.22. (E) Exhaled aerosol particle numbers from 87 mildly symptomatic COVID-19 subjects. (F) Mean exhaled aerosol numbers for the 87 COVID-19 patients as a function of time period of infection and recruitment. Error bars represent standard errors of the mean. *P < 0.05, **P < 0.005, ***P < 0.0005.

