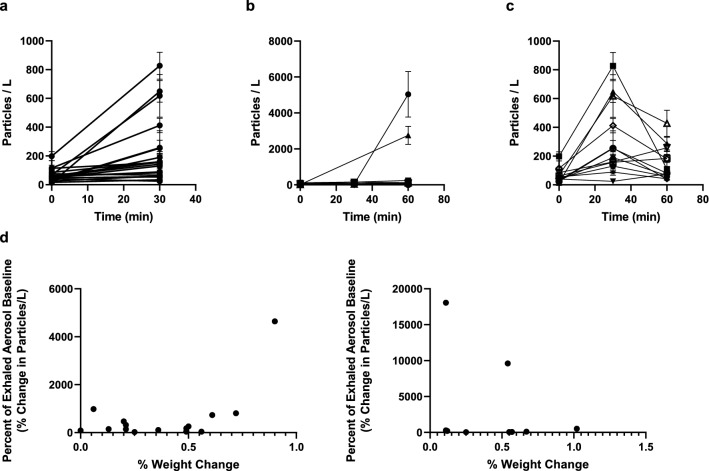
Figure 3.
Exhaled aerosol particle numbers from healthy human subjects in an exercise-induced dehydration study. Shown are (A) all subjects before and after 30 min of exercise; (B) all non-treatment control subjects before, during and after 60 min of exercise; (C) all active subjects before and after administration at 30 min of exercise of upper-airway salts; (D) all subjects as a function of dehydration weight loss over the course of the exercise-induced dehydration study after 30 min (left) and all control subjects after 60 min (right). Error bars represent standard errors of the mean.

