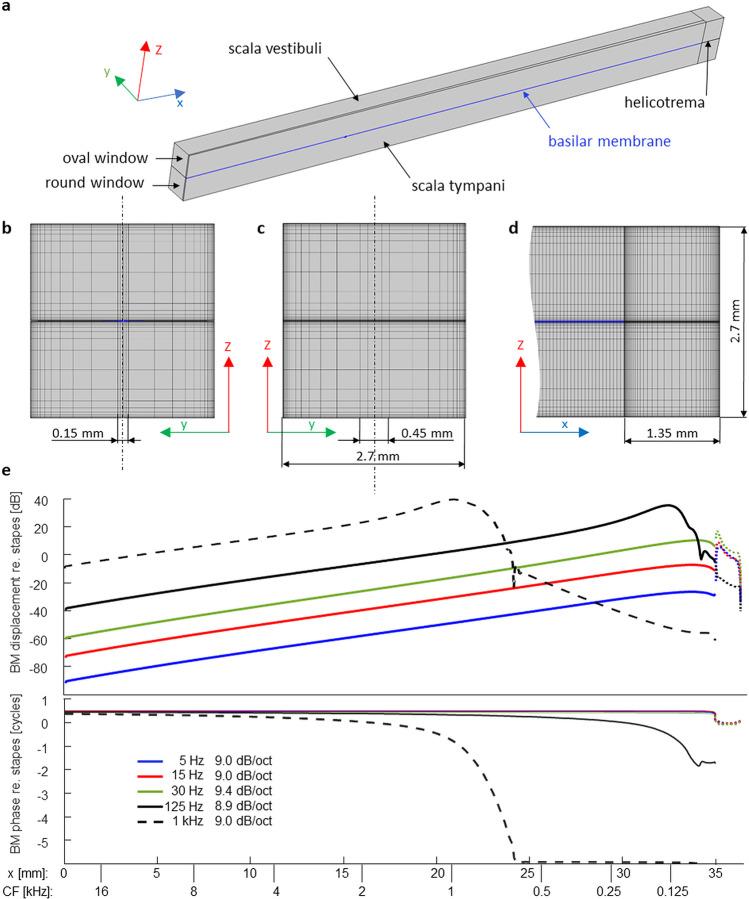
Fig. 3.
Finite element model of the human cochlea. a Fluid compartments (gray) and BM (blue) of half of the cochlear box model (i.e., half its width). Because its cross sections were symmetrical, only one half of the model had to be numerically solved. b View of the cross-sectional mesh in the x-direction. c View of the cross-sectional mesh in the opposite direction, showing the surface of the helicotrema compartment. The vertical dash-dotted lines in b and c indicate the model’s symmetry. d Lateral view of the mesh at the apical end of the (half) model shown in a in the y-direction, including the 1.35-mm-long helicotrema compartments. e Magnitude and phase of BM displacement along the cochlea in response to tones of various frequencies. The dotted lines beyond 35 mm represent fluid displacement inside the helicotrema. The legend in the lower panel gives also the slopes of the displacement expressed in dB/octave between the characteristic frequencies (lower abscissa scale) of 0.5 and 16 kHz (only 2–16 kHz for the 1-kHz tone), derived from the characteristic places for tonal stimulations. As can be seen in the lower panel, the BM moves in-phase along its entire length when stimulated at and below 30 Hz

