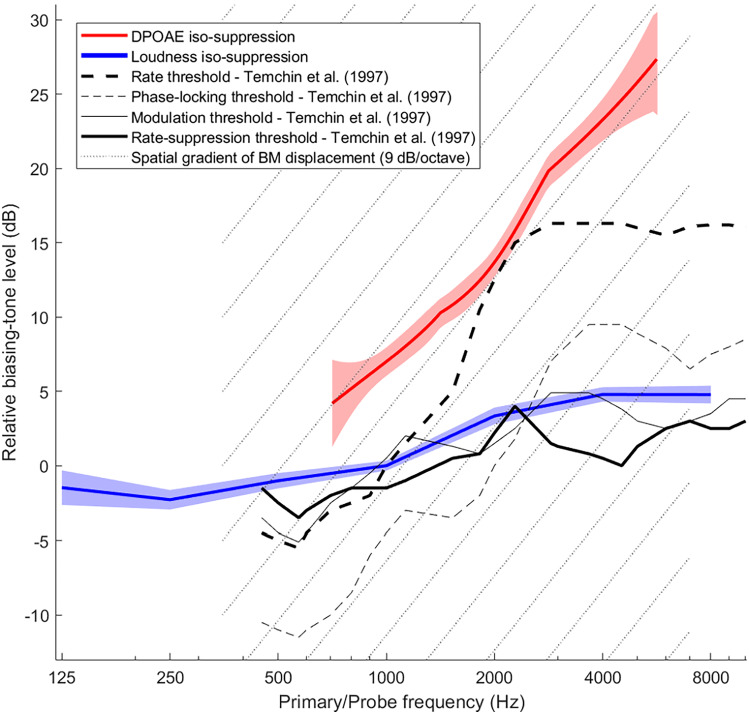
Fig. 5.
Relative BT threshold levels for DPOAE suppression (red) and loudness-suppression (blue) combined over all subjects (main and control experiments) by cumulative-slope analysis (see Methods). Shaded regions represent standard error of the means for the local slopes. The loudness iso-suppression curve was given an arbitrary level of 0 dB at 1000 Hz. The DPOAE iso-suppression curve was set higher by 7 dB at 1000 Hz, corresponding to the difference in BT levels required for DPOAE and loudness suppression at this frequency. (This difference was averaged across all 15-Hz and 30/31-Hz data from the main experiments only). For comparison, chinchilla auditory-nerve data from Fig. 11 of Temchin et al. (1997) are also shown at an arbitrary level scale as function of fiber CF, while keeping their original relative levels. Solid lines represent thresholds for suppression of CF tones. Their slopes are very similar to our loudness iso-suppression curve. Dashed lines represent thresholds to the suppressor tones alone, which had frequencies between 50 and 400 Hz. Below 2 kHz, their slopes rather match that of our DPOAE iso-suppression curve. For convenience, the grid of dotted lines indicates the slope of 9 dB/octave expected for the longitudinal gradient of BM displacement in response to the suppressor tones

