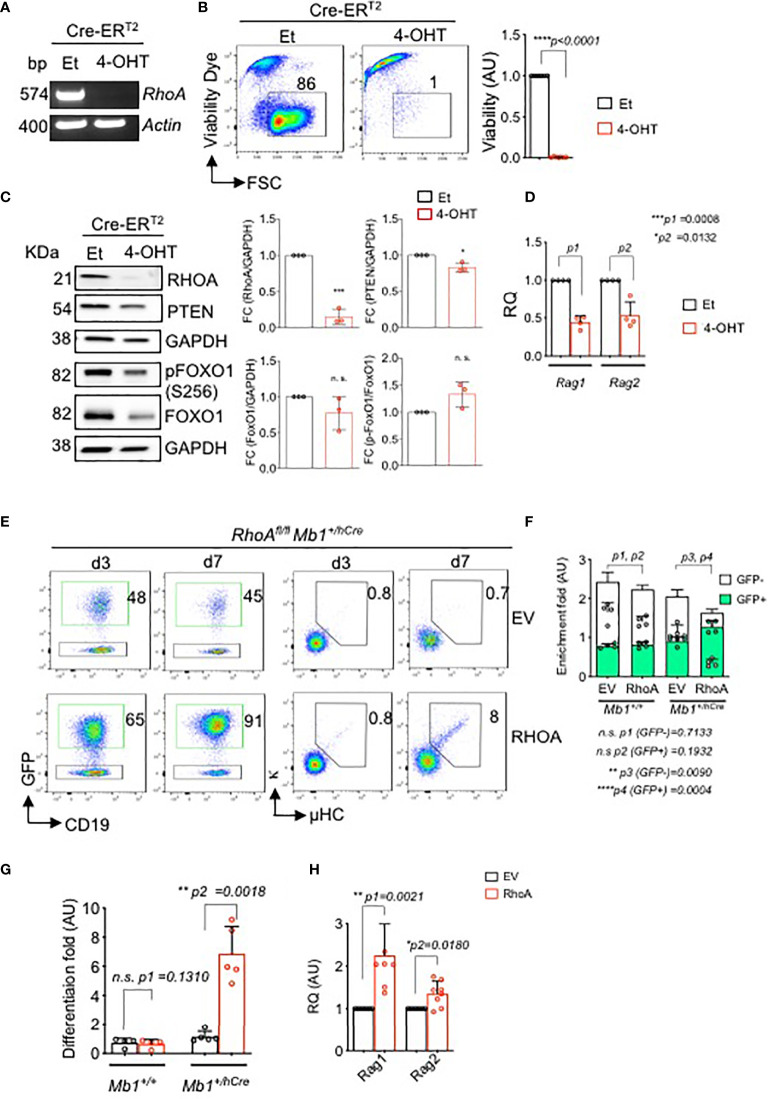
Figure 5.
In vitro deletion of RhoA leads to cell death and impaired immunoglobulin gene rearrangement and B cell differentiation. RhoAfl/fl Mb1+/+ pre-B cells were transduced with Cre-ERT2. Cells were then treated with either 4-OHT to induce Cre expression, or with Et. (A) RT-PCR analysis for RhoA gene expression after 2 days of tamoxifen induction. Actin was used as a loading control. bp: base pair. (B) Left- flow cytometric analysis of viability of RHOA deleted cells using Sytox dye after 4 days of tamoxifen induction. Right- the fold change of living cells after treatment with either Et or 4-OHT at day 4. N=6 independent samples per group, and error bars represent mean ± SD. Paired t-test, two-tailed. (C) Left- western blot analysis showing expression of RHOA, PTEN and phospho FOXO1 after 2 days of tamoxifen induction. Data representative of three independent experiments. Right- quantification of the western blots. RHOA, PTEN and total FOXO1 blots are normalized with GAPDH while p-FOXO1 is normalized with total FOXO1. Bars represent mean ± SD. Statistical test- unpaired t test. (D) Quantitative RT-PCR showing Rag1 and Rag2 expression after RhoA deletion. N=4 independent samples per group, and error bars represent mean ± SD. Paired t-test, two-tailed. (E) RhoAfl/fl Mb1+/+ or RhoAfl/fl Mb1+/hCre pre-B cells were reconstituted with either an empty vector (EV, pMIG) or with RhoA retroviral expression vector (pMIG-RHOA). Left- Flow cytometric analysis showing enrichment of RhoAfl/fl Mb1+/hCre cells transduced with either an EV or RHOA (GFP+ population) after 3 and 7 days of transduction. Right- Flow cytometric analysis showing an increase in the percentage of differentiated cells (µ+kappa+) in RhoA-deficient cells which were reconstituted with RhoA (N=5). (F) Quantification of enrichment of GFP+ pre-B cells from RhoAfl/fl Mb1+/+ or RhoAfl/fl Mb1+/hCre mice reconstituted with either EV or RhoA. Enrichment fold represents the ratio of CD19+GFP+ or CD19+GFP- at day 7 relative to day 3. N=4 independent samples per group, and error bars represent mean ± SD. Paired t-test, two-tailed. (G) Quantification of enrichment of differentiated cells (µ+kappa+) as calculated by the ratio of µ+kappa+ at day 7 relative to day 3. N=4 independent samples per group, and error bars represent mean ± SD. Paired t-test, two-tailed. (H) Quantitative RT-PCR showing up-regulation of Rag1 and Rag2 gene after RHOA reconstitution in RhoAfl/fl Mb1+/hCre . N=4 independent samples per group, and error bars represent mean ± SD. Paired t-test, two-tailed. *p<0.05, **p<0.01, ***p< 0,001, ****p<0.0001, ns, not significant.

